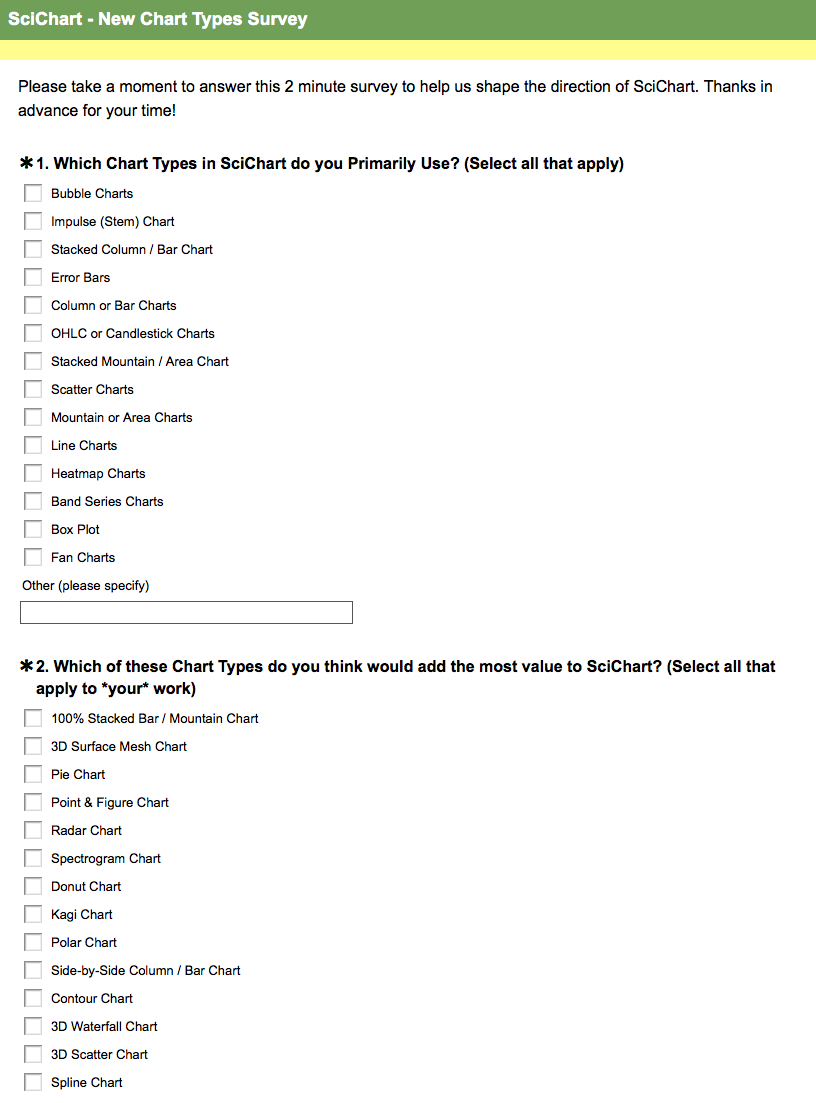
Over the past 6 months we have received loads of feature requests from our users and many of them are around incorporating new chart-types into SciChart. What we would like to know from you is which of these are the most important?
Please take a moment to answer our super short 3-question survey. In it we ask
- Q: Which Chart Types do you primarily use in SciChart?
- Q: Which Chart Types do you think would add the most value to SciChart?
- Q: What else would you like to see from SciChart in the next 6-12 months?
Please try to answer from your perspective – which chart types would be most valuable to you and your future projects.
That’s it! Thank you in advance for your time!
Related Posts

