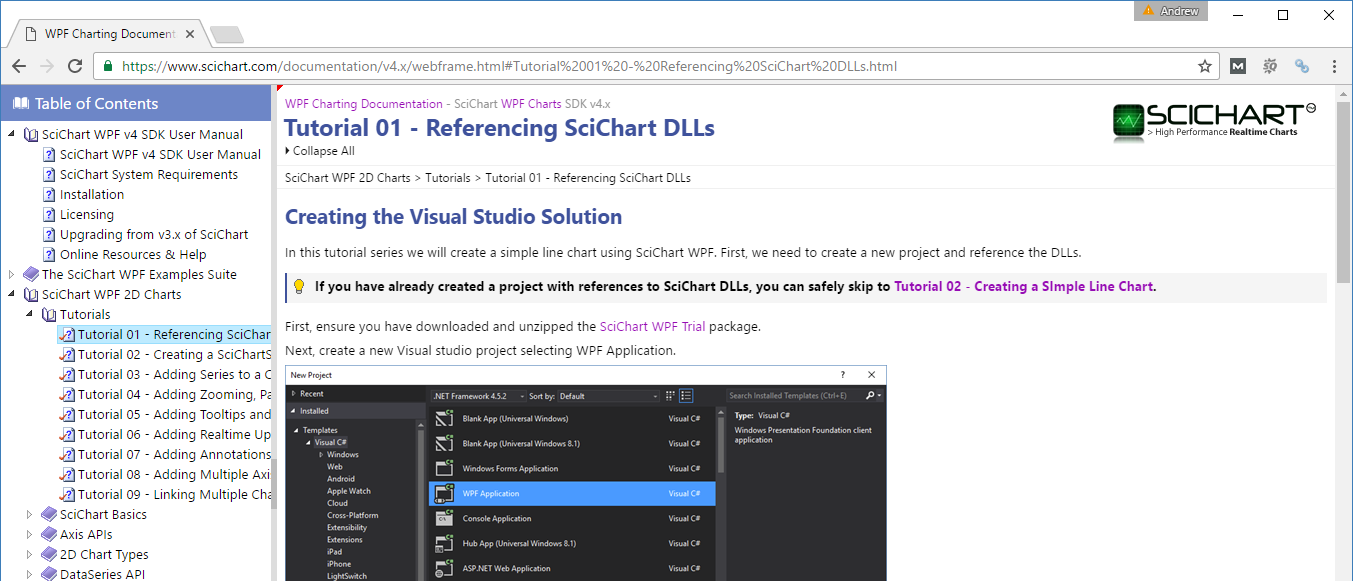
If you are new to SciChart WPF, or have recently started using it, it’s well worth taking a look at our new set of tutorials for SciChart WPF!
These include the following topics:
Tutorials include:
- WPF Chart Tutorial 01 – Referencing SciChart DLLs (5 minutes)
- WPF Chart Tutorial 02 – Creating a SciChartSurface (5 minutes)
- WPF Chart Tutorial 03 – Adding Series to a Chart (5 minutes)
- WPF Chart Tutorial 04 – Adding Zooming, Panning Behavior (10 minutes)
- WPF Chart Tutorial 05 – Adding Tooltips and Legends (10 minutes)
- WPF Chart Tutorial 06 – Adding Realtime Updates (15 minutes) uses some features from SciChart v4.2, which is in QA now and available on the nightly build feed only
- WPF Chart Tutorial 07 – Adding Annotations (10 minutes)
- WPF Chart Tutorial 08 – Adding Multiple Axis (10 minutes)
- WPF Chart Tutorial 09 – Linking Multiple Charts (15 minutes)
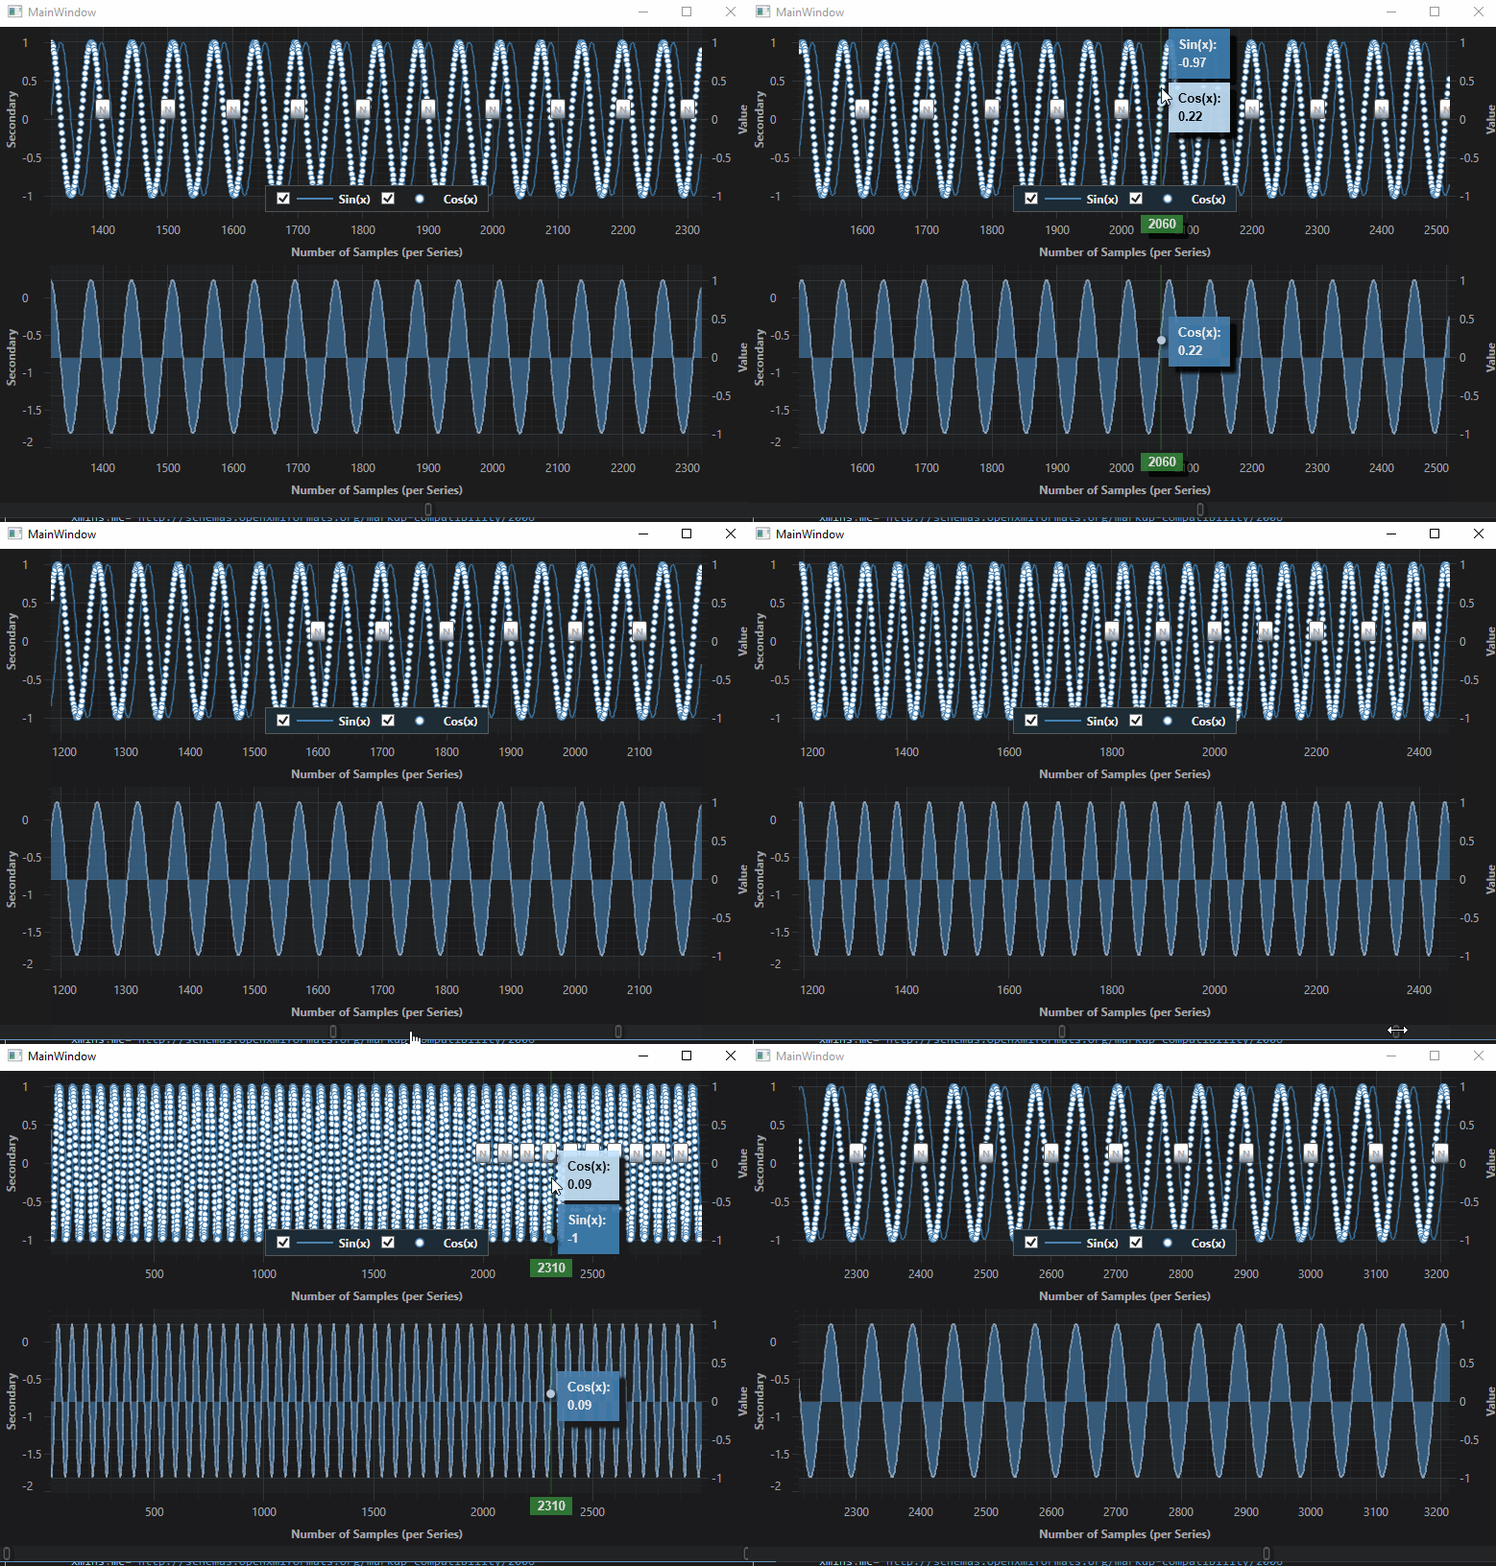
By the end of the tutorials you should end up with a multi-chart, multi-axis chart, with realtime updates and annotations, scrollbars, zooming and panning behaviour, tooltips and legends, which looks a little like this:

If you are experienced with SciChart WPF, it’s worth having a look to give us your feedback.
Also, if you have any feedback for us about topics to include for future tutorials that would also be greatly appreciated.
Thank you!
[SciChart Team]
Related Posts
