DirectX Compatibility in WPF Charts with SciChart
SciChart now features an optional DirectX10 based renderer. This is currently included as an add-on to the SciChart High Performance […]
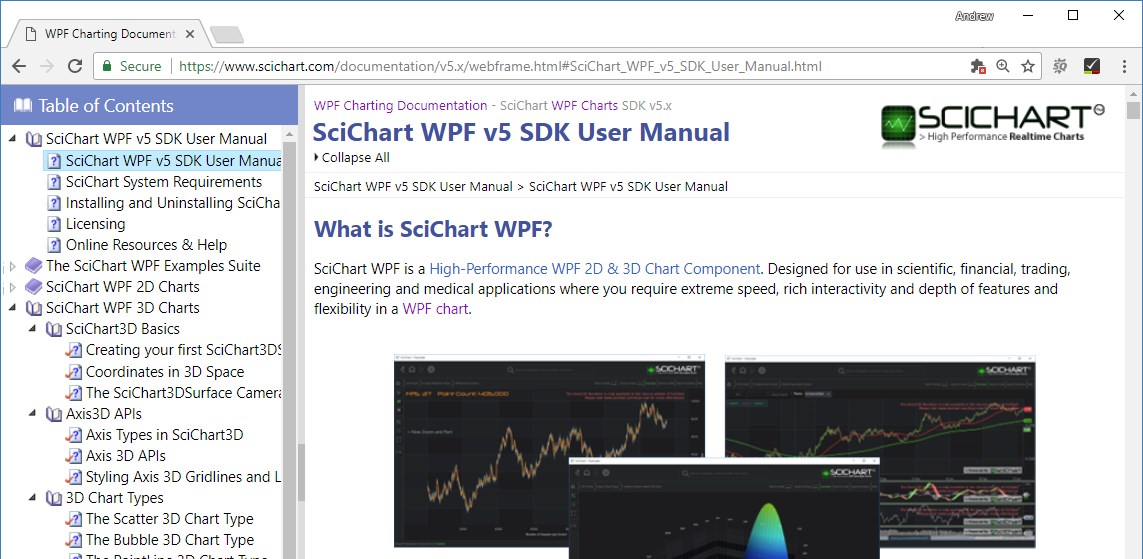
Never one to rest on our laurels, we’ve been busy at work the past few weeks writing the SciChart WPF v5 Documentation. This has been released today!
You can view the updated SciChart WPF v5 Documentation at https://www.scichart.com/wpf-chart-documentation
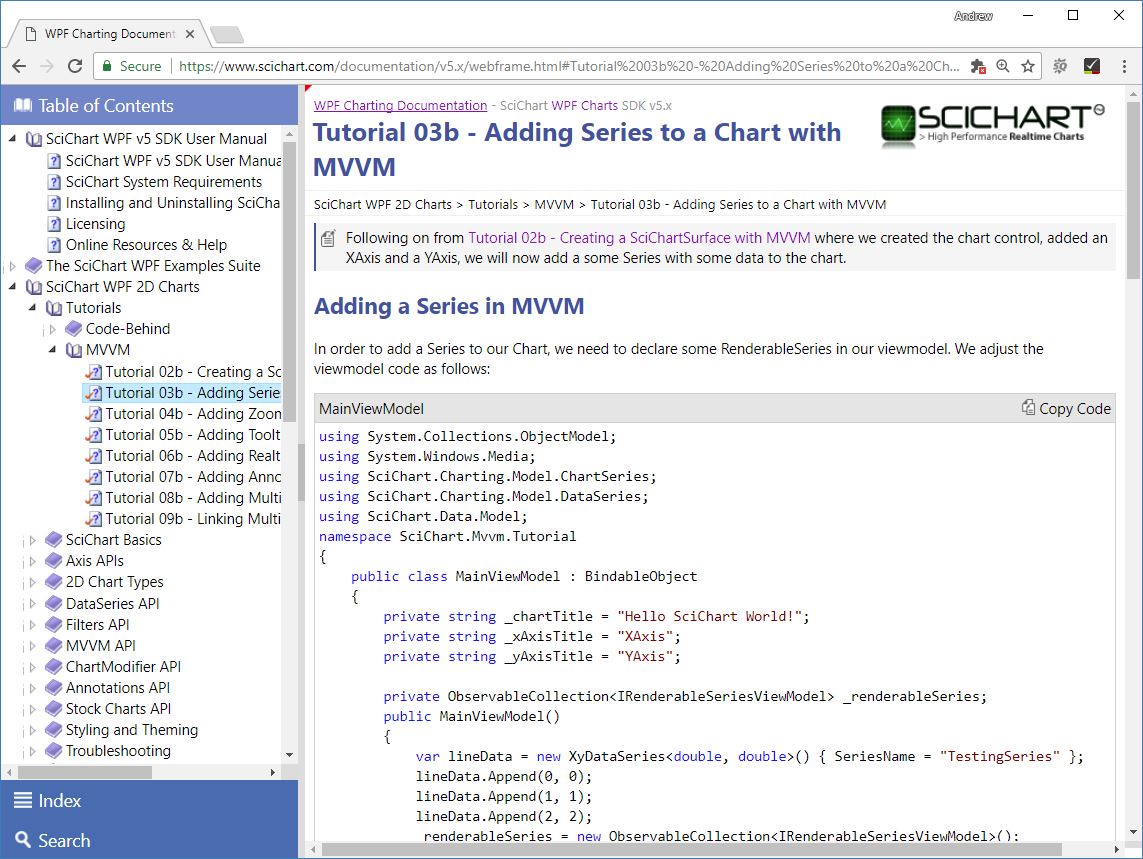
We have a new set of Tutorials on using SciChart with the MVVM API, including binding to series viewmodels, axis and annotations, updating charts in real-time and linking multiple charts and more.
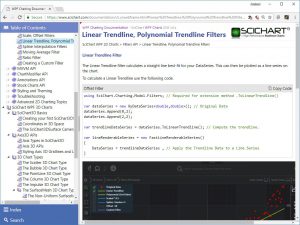
We have a set of documentation on using the Filters API – a brand new API in SciChart WPF v5
Documentation on the DiscontinuousDateTimeAxis, a new axis type in SciChart WPF v5, as well as how to create Volume, Range and Renko bars with our new APIs.
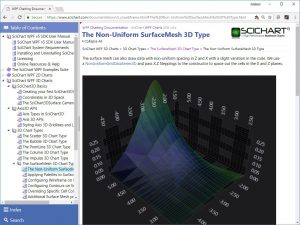
Documentation on the Uniform and Non-uniform Heatmap RenderableSeries, new series types in SciChart WPF v5, as well as the Radar Chart type.
Documentation on the MVVM Axis API and MVVM Annotations API, both new to SciChart WPF v5.
Some notes about increasing the precision of resampling using the Extreme Resamplers API.
Also, something we’re a bit embarrassed about since it was first released in 2016 … we have now published full documentation for SciChart WPF 3D Charts, where you can find out how to use our 3D Chart types.
Enjoy!
Best regards,
Andrew
Related Posts
![]()
Queens Award for Innovation
Proud winners of the Queens Award for Innovation, 2019. Awarded on account of our innovative graphics engine which underpins the SciChart library and enables our world-beating charting performance
![]()
National Business Awards
Highly Commended for Lloyds National Business Awards, 2019. Awarded on account of our innovative graphics engine and impressive customer base
![]()
National Technology Awards
Awarded “Healthcare Tech of the Year” at the 2025 National Technology Awards – a top UK recognition for breakthrough innovation in technology.

Reviews
SciChart has received hundreds of verified, 3rd party reviews