DirectX Compatibility in WPF Charts with SciChart
SciChart now features an optional DirectX10 based renderer. This is currently included as an add-on to the SciChart High Performance […]
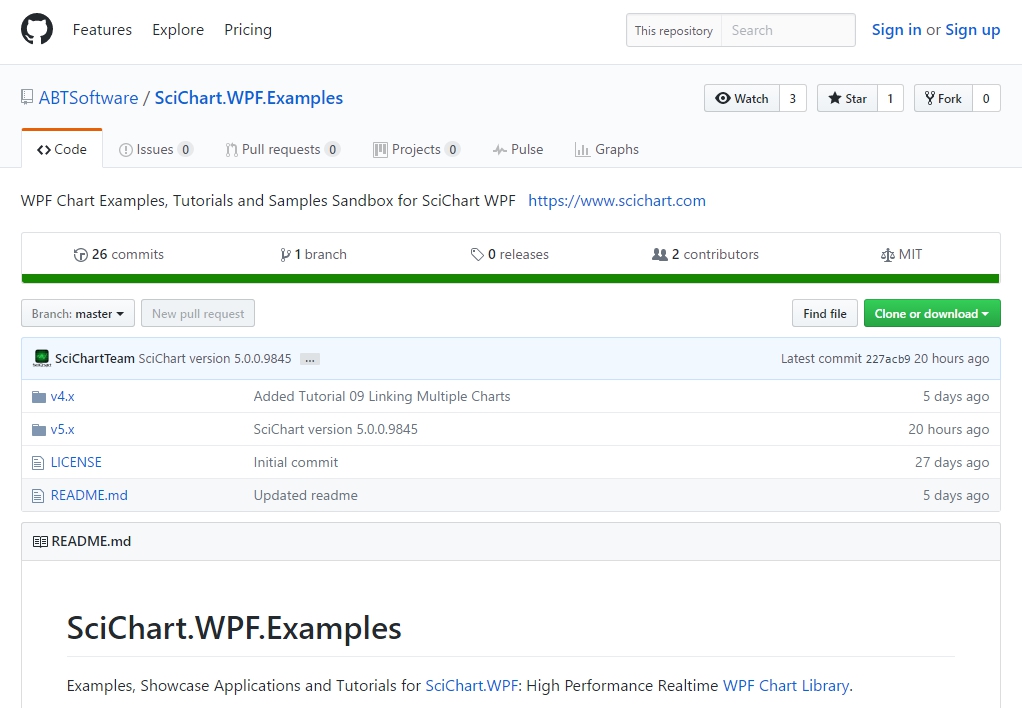
In the past few weeks, we have been working on shaping our product and vision for SciChart WPF, with the help of feedback from our userbase and potential customers. One of the requests which you have asked for is the ability to have the SciChart WPF Examples source code available *outside the installer*. As a result, we have taken the step to setup automatic publishing of the SciChart WPF Examples Suite to Github, referencing the SciChart WPF DLLs from NuGet. We are hoping that this will be a powerful resource which will enable our users to fall into the pit of success when using SciChart!
The SciChart WPF Examples Repository can be found on Github under the ABTSoftware organization. This is a public repository with an open source License. You are free to clone it using Git or SVN clients, download the code, and use anything in it for commercial or open source purposes.
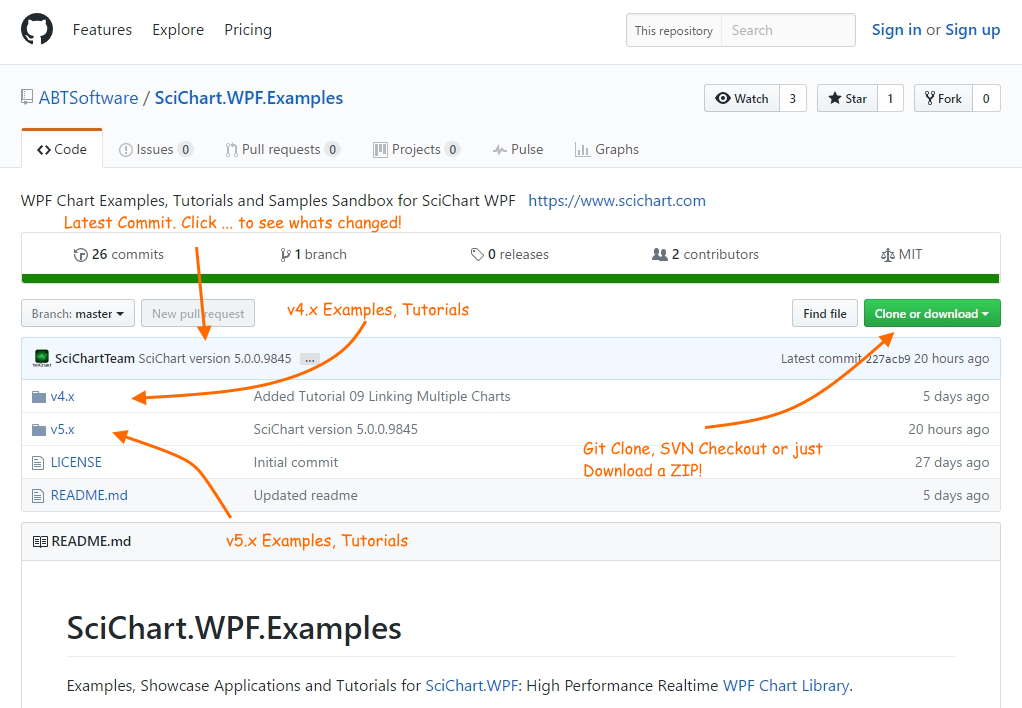
That’s right! You heard correctly. We are now publishing an Early Access Preview of the the SciChart WPF Examples v5 to the Github repository, along side SciChart WPF v5 BETA to our abtsoftware-bleedig-edge (BETA) NuGet Feed.
SciChart WPF v5 IS A VERY EARLY BETA. This version of SciChart is very much in flux. We wanted to be able to showcase what we have been working on as well as give some of our customers early access to the next major version of SciChart, which is currently on schedule to be released in May.
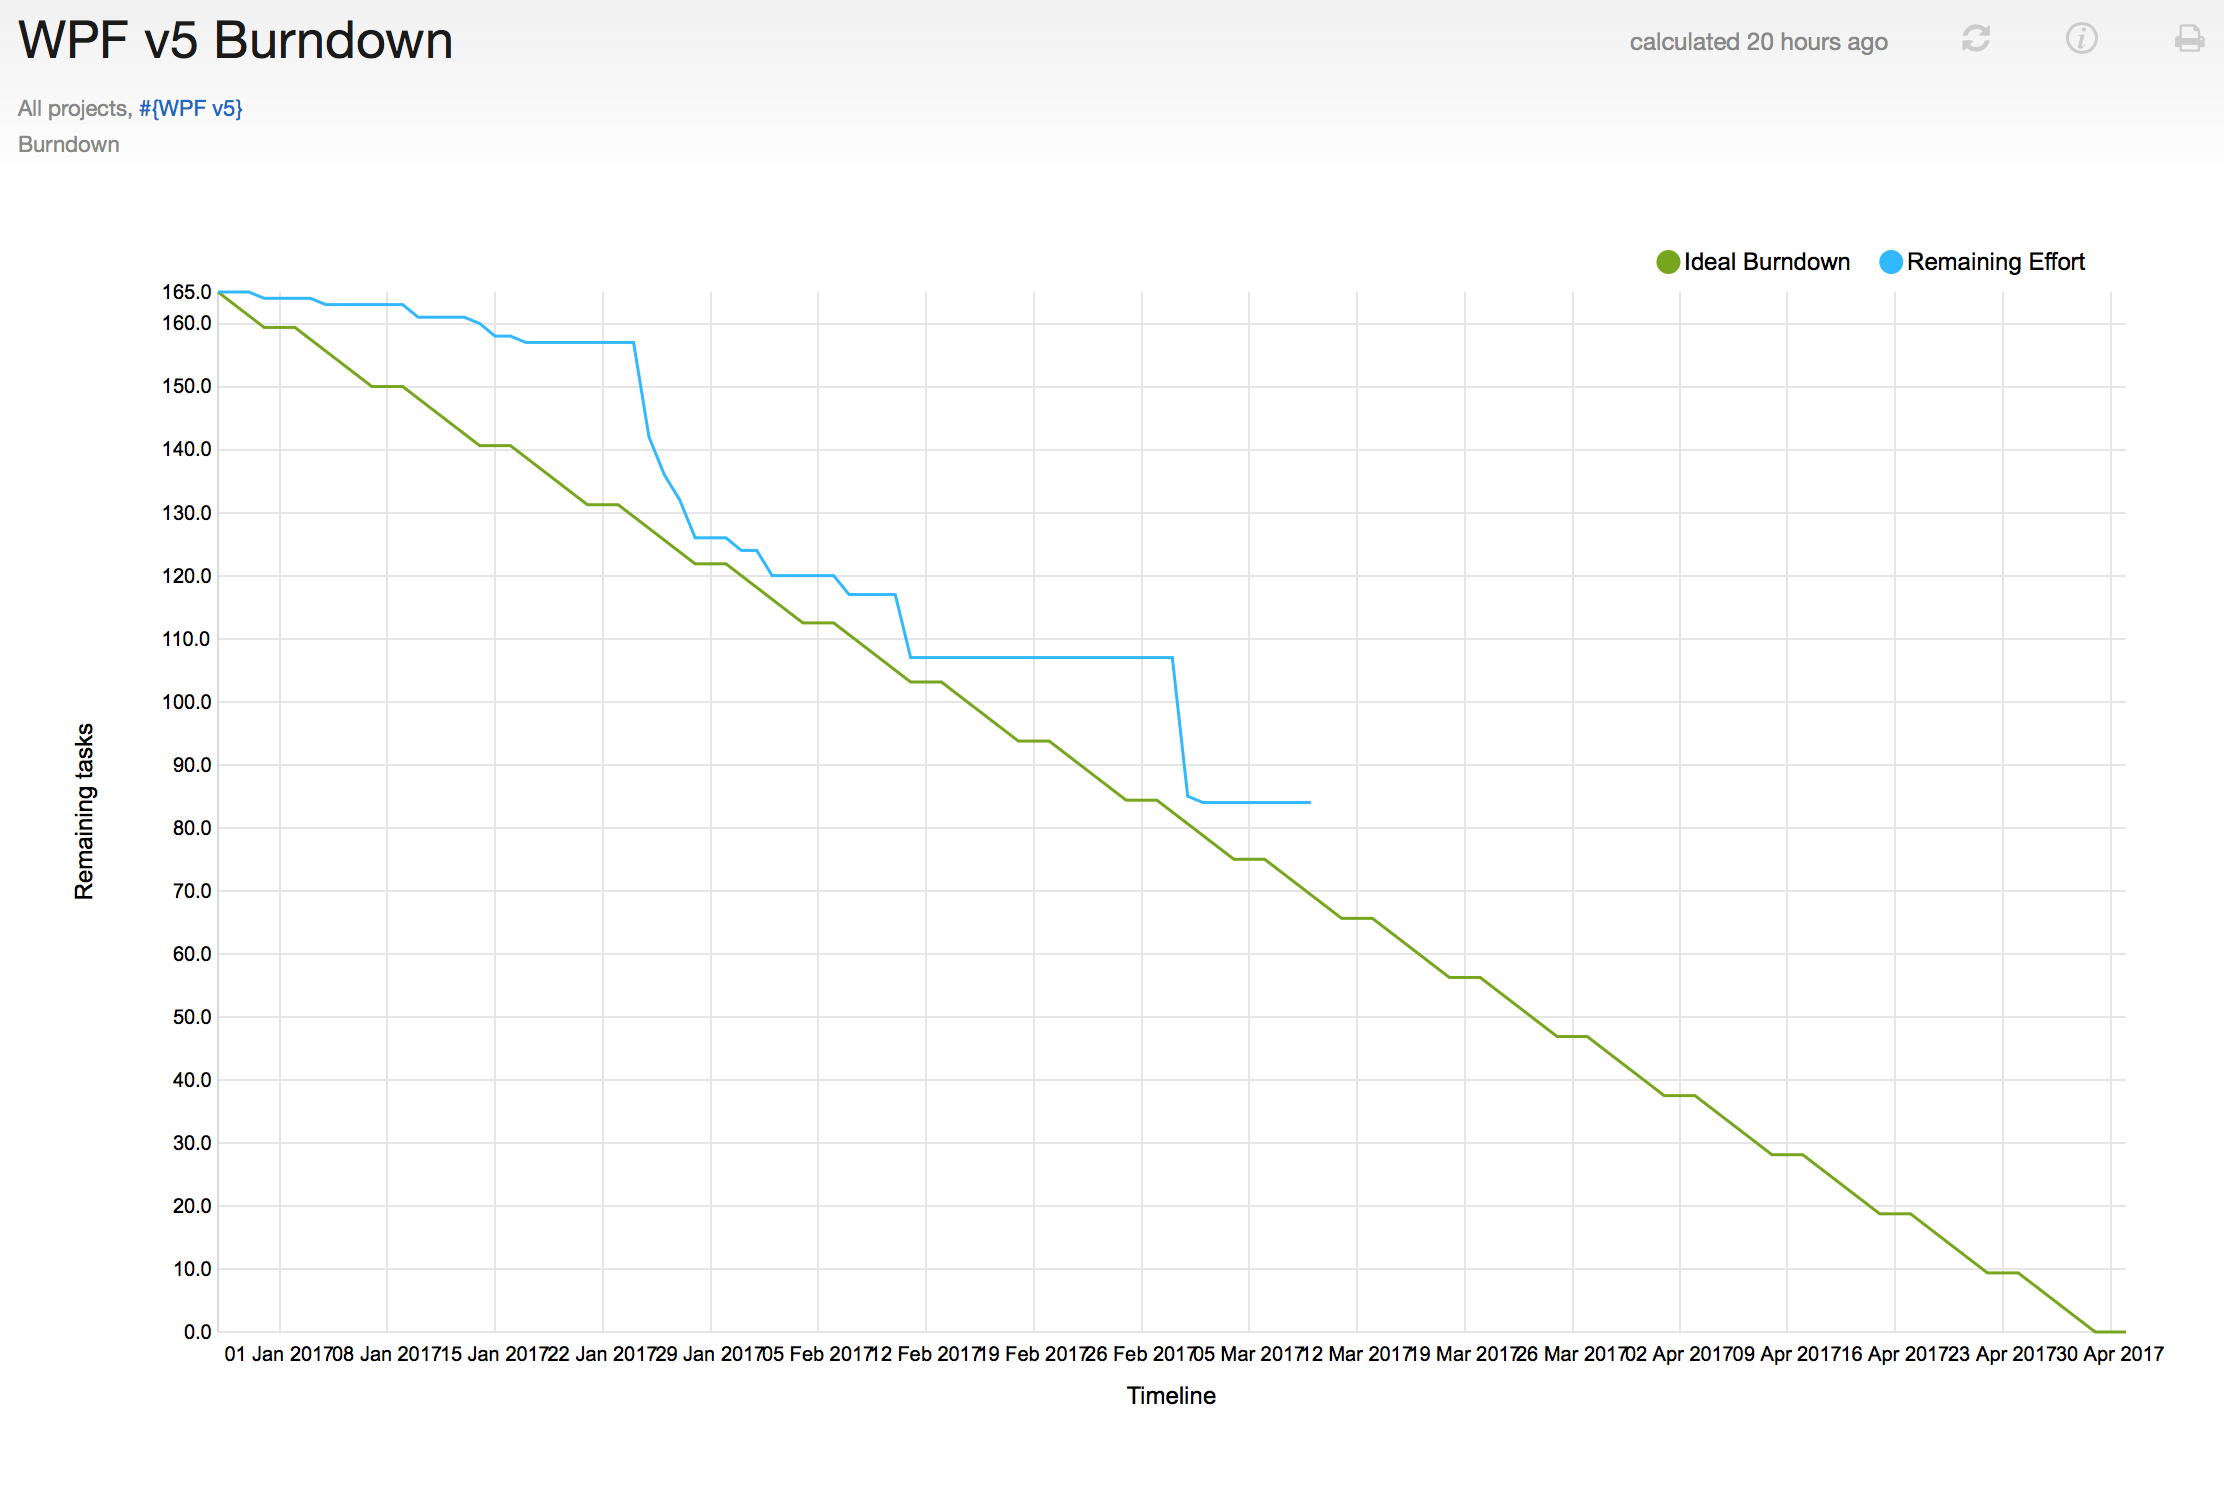 WPF v5 Burndown Chart as of March 2016. Expected delivery in May 2016
If you want to see what we’re doing for SciChart WPF v5, head on over to our Public Issue Tracker where you can see the sprints, the tasks in progress and our statuses. ‘Delivered’ state means published to NuGet & Github!
From one of the surveys we learned that Radar Charts are important to many users.
This 2D Chart will be added to SciChart WPF v 5 to allow displaying radars with customizable axes and selectable series or data-points. This chart type has been built from the ground up using our fast 2D drawing technology and looks great!
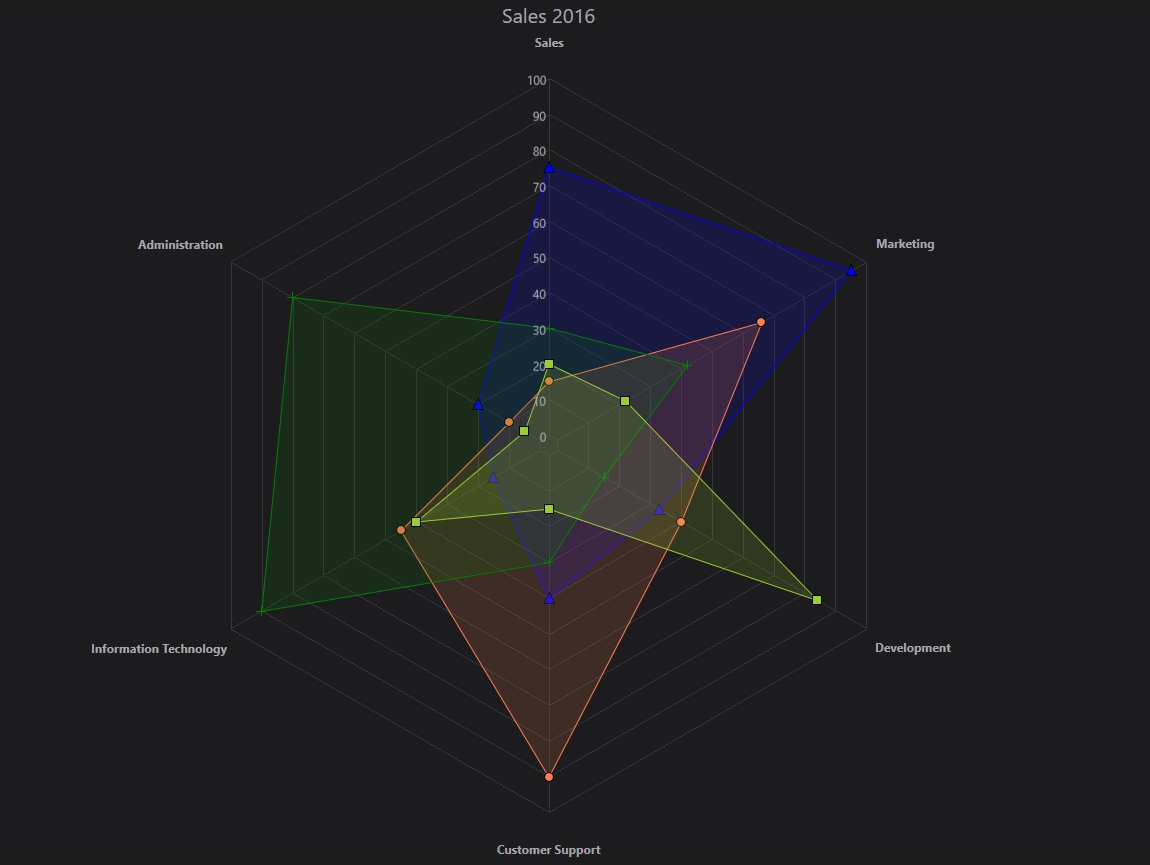 The WPF Radar Chart type allows unlimited, configurable ‘Radar Axis’ with data series as Polygons, Point-Markers or Lines. Tooltips and Legends and theming come as standard
You can see an example of use here.
In WPF v5 new DiscontinuousDateTimeAxis type is going to be introduced. This is a special axis type, specifically for financial / trading charts, which will allow you to skip ranges (overnight, weekend). It will support series with differing lengths for the first time in trading charts. This opens the possibility of all sorts of indicators and filtering techniques previously impossible with SciChart. It will allow you to use Range, Tick, Volume or Time based bars. It preserves the position on Annotations on time-frame changes. It allows showing/hiding of overnight trading on exchanges with extended trading data.
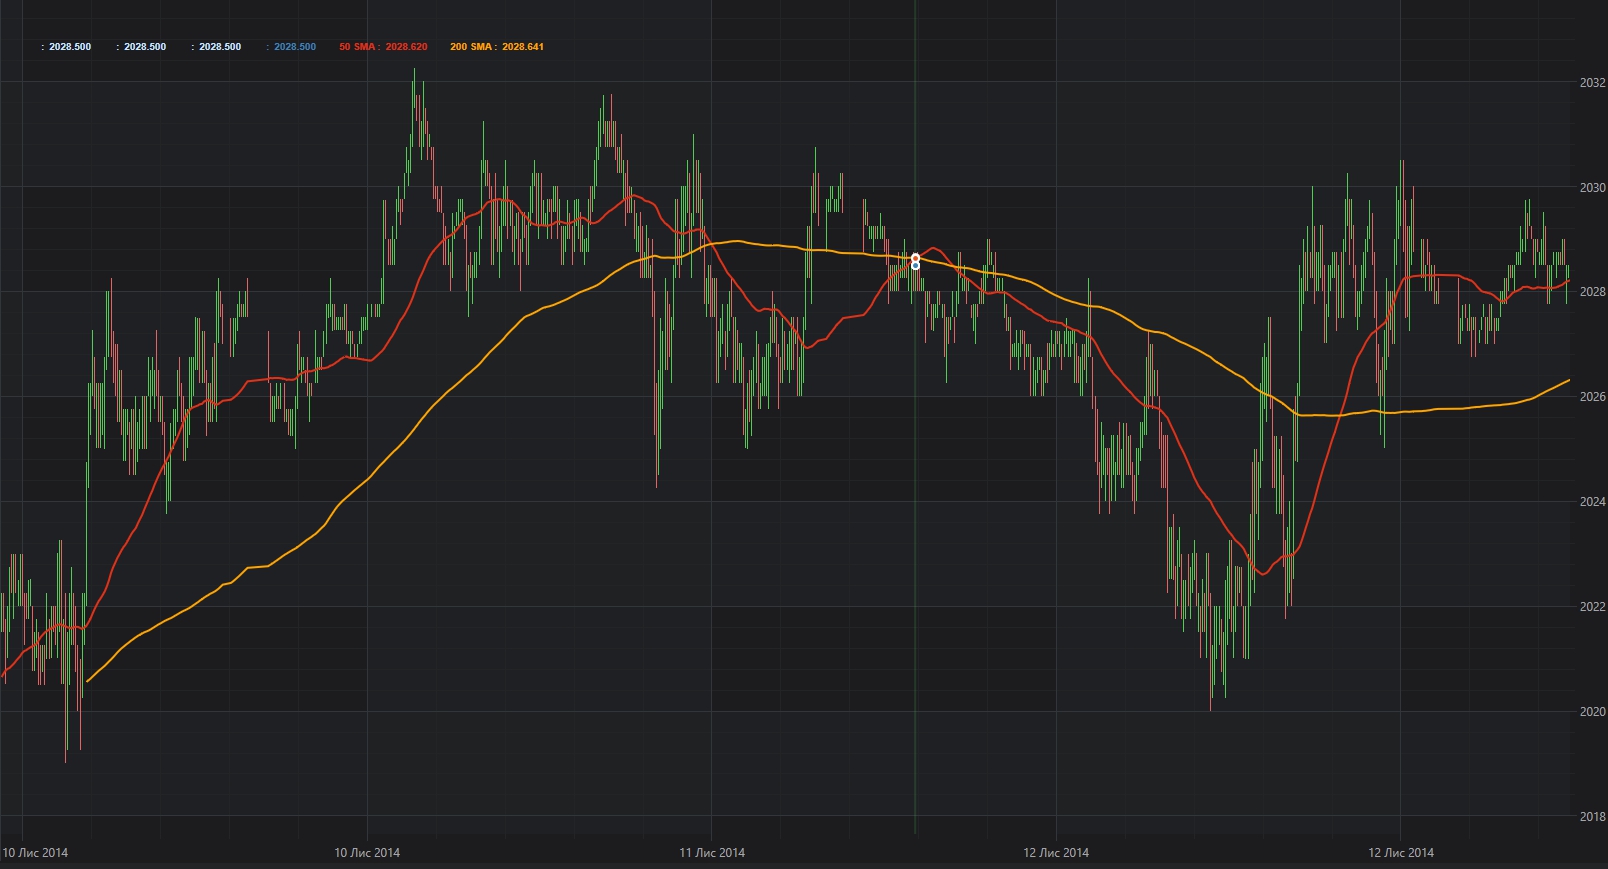 The DiscontinuousDateTimeAxis type allows Volume, Range, Price and Tick Bars as well as a calendar for skipping overnight segments/weekends for true support for financial stock charts.
You can see an example of use here.
The heatmap type is undergoing radical transformation. We have a new FastUniformHeatmapRenderableSeries. This is up to 10x faster than the existing FastHeatmapRenderableSeries for the case where cells are uniformly spaced and supports the PaletteProvider API. This works best with DirectX.
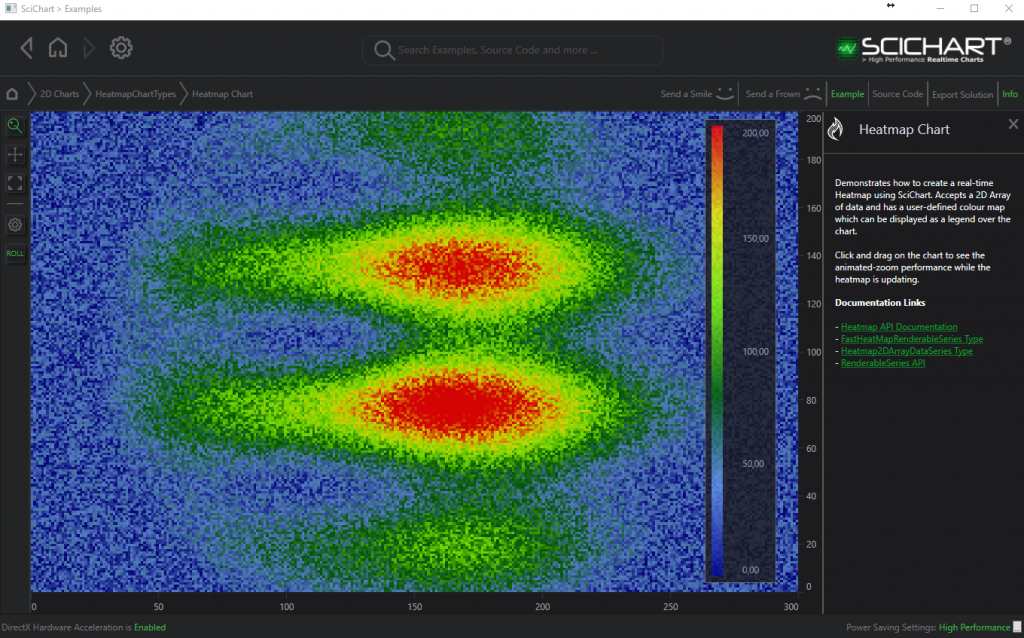 The Uniform heat map type has been heavily optimised, now yielding up to 10x faster rendering when compared to v4.x FastHeatmapRenderableSeries
You can see an example of use here
Still in progress, we have a Non-Uniform heatmap type which will supercede the existing FastHeatmapRenderableSeries. This fixes issues where the Y cells don’t match the spacing provided by the user. We also hope it will be faster and more flexible than the existing FastHeatmapRenderableSeries. Still a work in progress :)
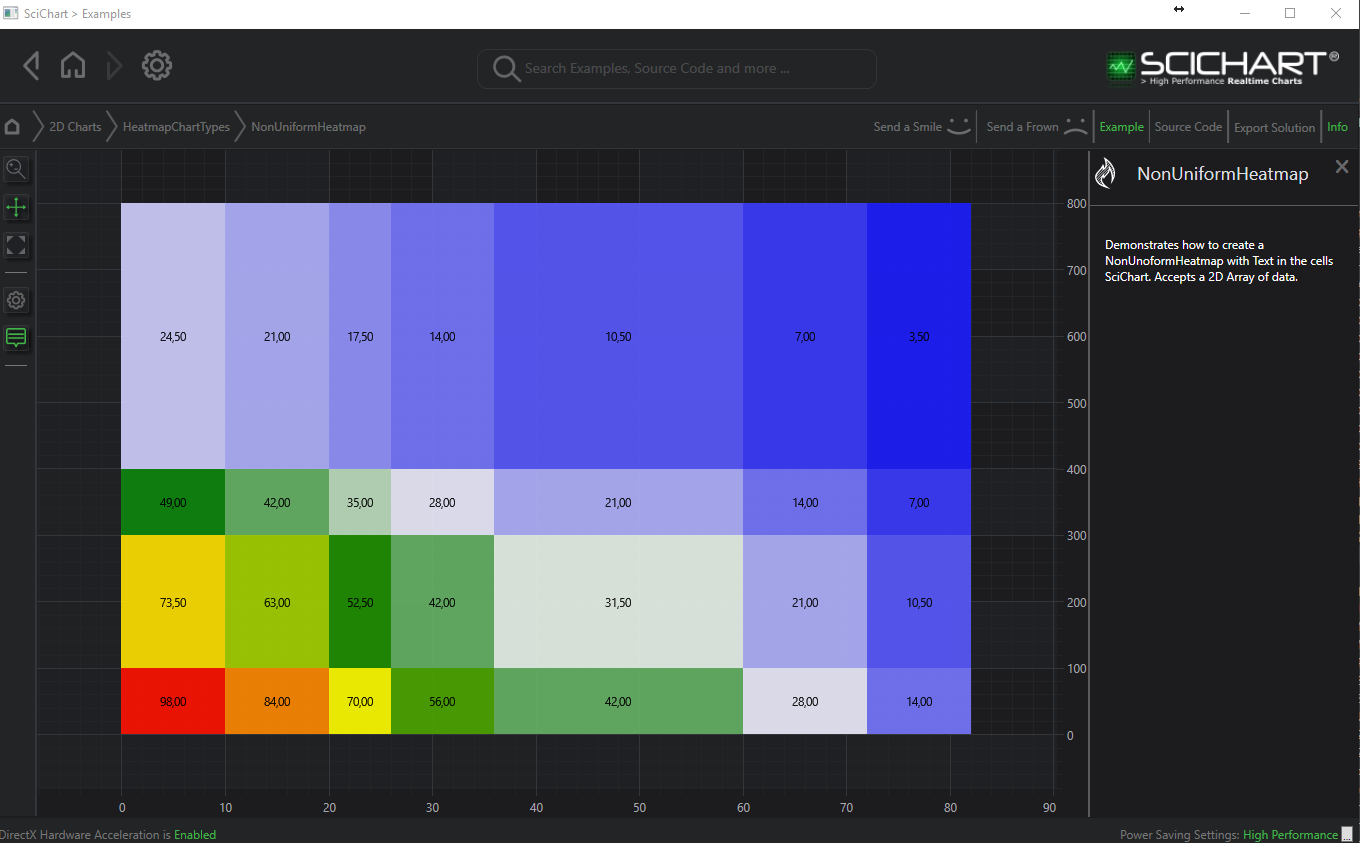 The new Non-Uniform Heatmap in SciChart WPF v5 fixes several issues that were present in the Heatmap from v4
You can see an example of use here
Still in progress, following the success if our SeriesBinding MVVM API in SciChart WPF 2D Charts, we have extended this API to cover Axis, Annotations in 2D Charts as well as Series and Axis in 3D Charts.
The new MarkupExtensions which will allow you to manipulate series, axis, and annotations from the ViewModel are:
You can see an example of use will be published shortly to the SciChart WPF v5.x Examples Suite.
A new Waterfall Chart Type, for viewing area/slices from a 2D array data series, displayed in a 3D Chart. Both realtime and static versions of the chart will be provided.
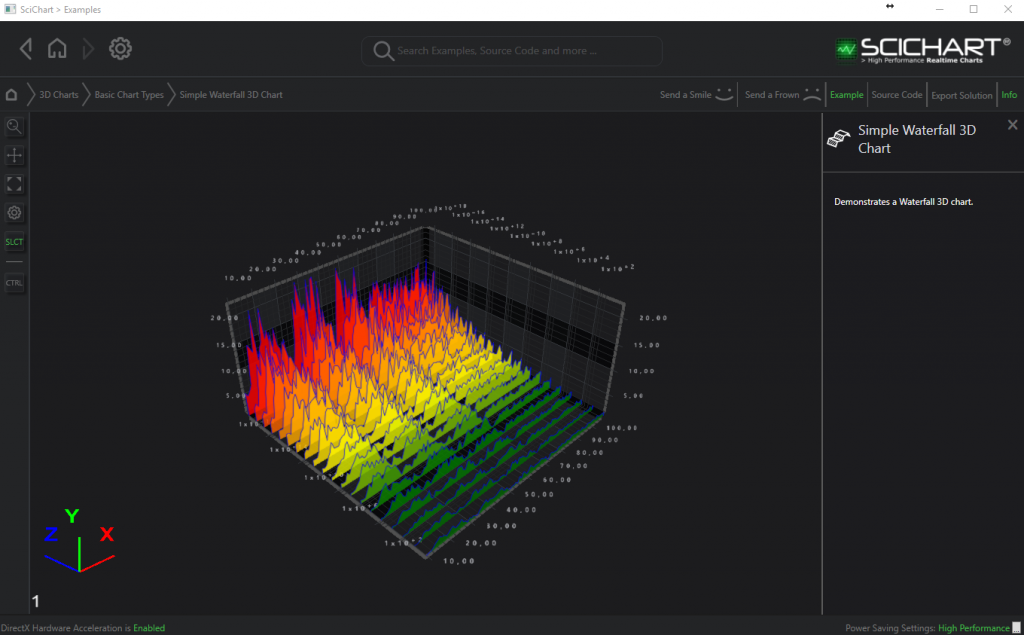 The new WPF Waterfall 3D Chart Type allows rendering of mountain slices at discrete intervals in 3D. Also supports realtime updates!
Customers looking for point clouds charts will be able to render more than a million points. We are pleased to announce that we have improved our Point –Cloud chart has been heavily optimised to put more emphasis on the Graphics Card. As a result, Point Clouds in SciChart v5.x are up to 10x faster in SciChart v4.
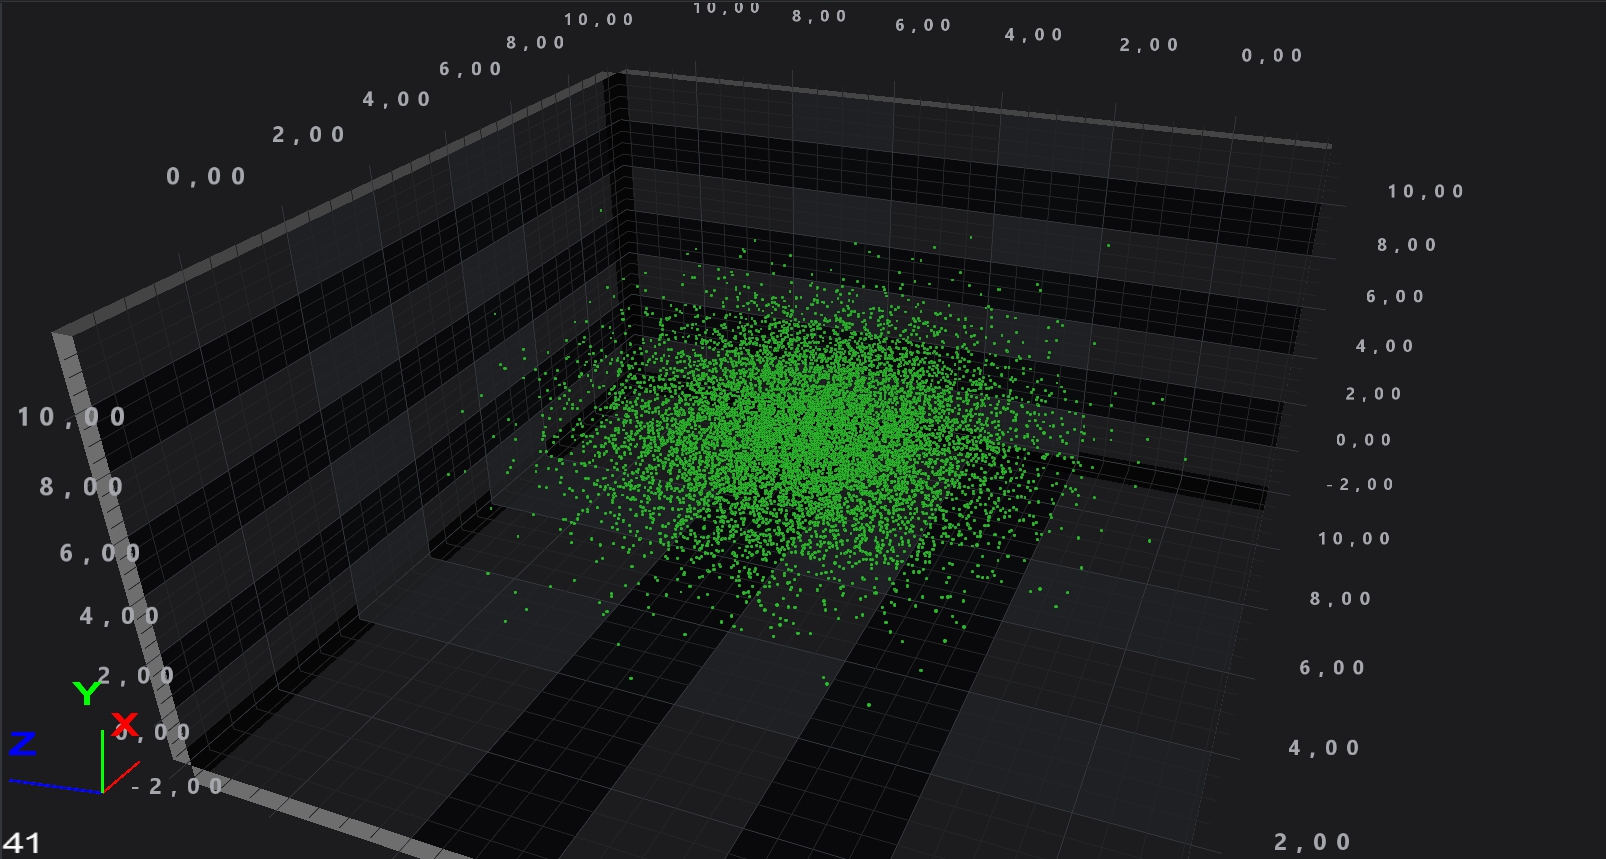 3D Point Cloud and 3D Scatter Charts in SciChart v4.x were a performance bottleneck. These have been optimised heavily for SciChart WPF v5!
PointLine 3D Charts are also up to 5x faster. These are now more heavily GPU reliant so if you have a powerful graphics card, you will see a bigger performance boost than before.
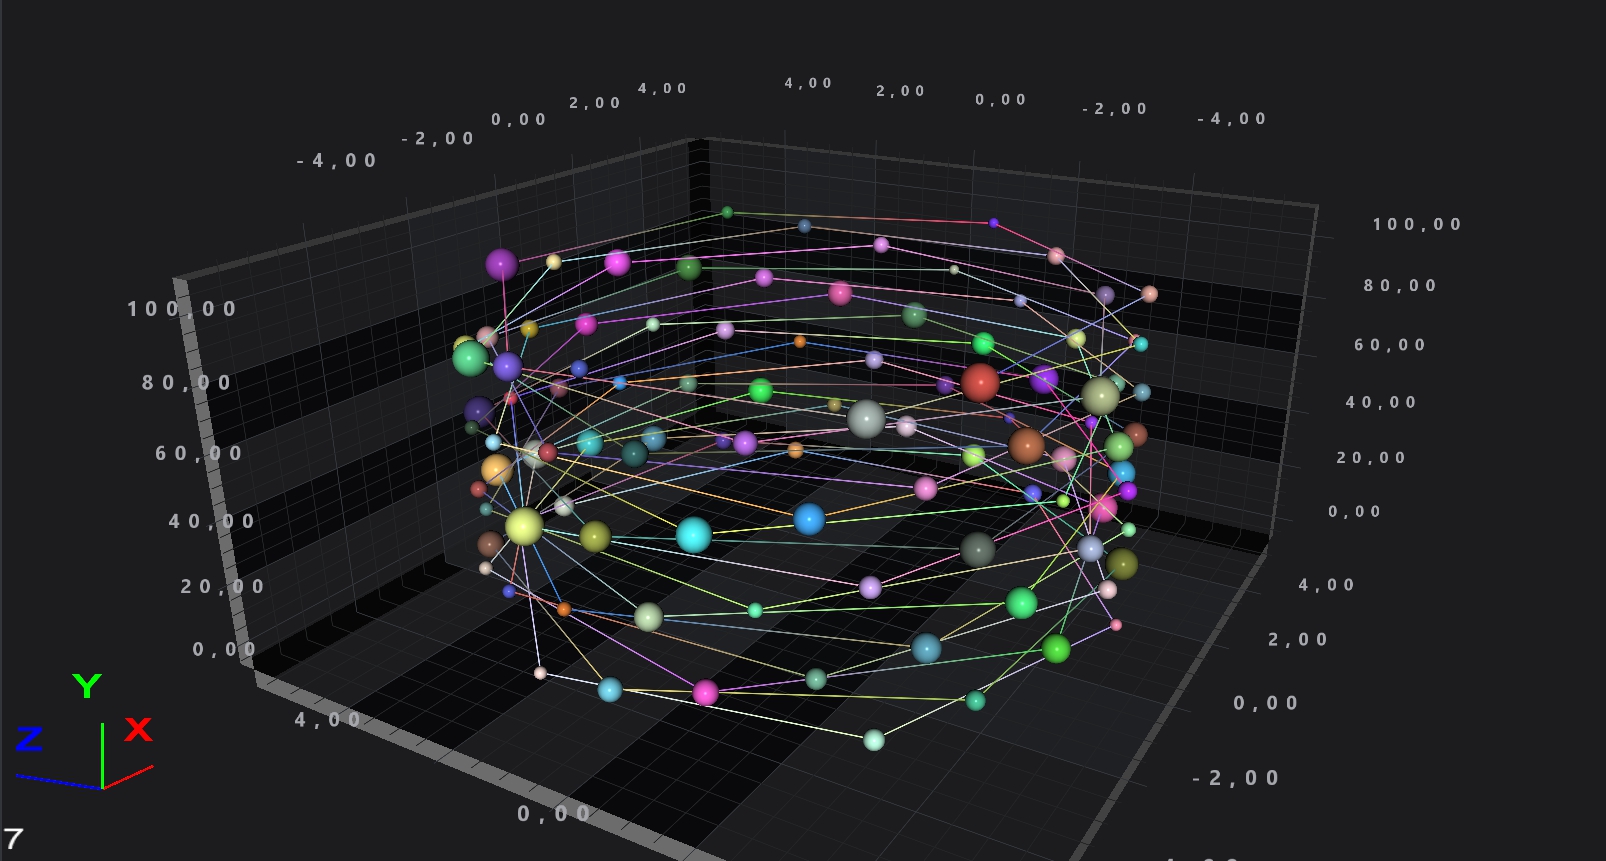 Point-Line 3D Charts in SciChart v4 were slow, so we spent time to optimise these heavily to be more GPU reliant.
Waterfall3D Charts have been written full GPU accelerated. This chart type is slick and fast and able to handle hundreds of slices with thousands of points each, updating in realtime.
Don’t forget the Heatmap type which is now 10x faster for the uniform case!
Finally, we’re aware that some users have asked for more performance in specific cases, notably:
These are on our radar :) The Scatter Series we basically have to re-write to allow sending X,Y coordinate and Color to the graphics card. If we do that it will dramatically improve performance. The FIFO chart we did improve a little bit in v4.2.3 but what we really need to do is avoid a copy step and unwrap data before drawing. In prototype we saw 5-6x performance increase for huge FIFO data series.
Until then, there are workarounds, so if you are experiencing one of the two performance issues above, Contact Us and we will do our best to help.
Our approach is continuous delivery, report a bug, sometimes we fix it same-day and push to Github/ NuGet. If you’re a SciChart WPF customer you can get the code changes within minutes and apply them to your build, allowing you to get on with your day to day business. Now how many can say that!
Please note that the examples published from v5 are still work in progress. They are likely to change and the API for SciChart WPF v5 will change as we work on it.
There are some API changes from SciChart v4 – > v5. This should be considered a breaking change. We haven’t yet collated and published a list of API changes. This will occur when we are ready for release.
SciChart WPF v5 will be a free upgrade to all existing customers of SciChart WPF who are within support subscription. If you purchase SciChart WPF licenses with support subscription today, then SciChart WPF v5 will be included for free when it is released.
If your support has expired recently, and you wish to try out SciChart WPF v5, then please get in contact with Sales to arrange a renewal, which you will be entitled to a discount for!
If you want to try out SciChart WPF v5 Early Access Preview then feel free! If you have any feedback for us, we would love to hear it.
best regards,
[The SciChart Team]
Related Posts
![]()
Queens Award for Innovation
Proud winners of the Queens Award for Innovation, 2019. Awarded on account of our innovative graphics engine which underpins the SciChart library and enables our world-beating charting performance
![]()
National Business Awards
Highly Commended for Lloyds National Business Awards, 2019. Awarded on account of our innovative graphics engine and impressive customer base
![]()
National Technology Awards
Awarded “Healthcare Tech of the Year” at the 2025 National Technology Awards – a top UK recognition for breakthrough innovation in technology.

Reviews
SciChart has received hundreds of verified, 3rd party reviews