SciChart, a leading supplier for 80% of top US and UK banking institutes, has been selected to power Commerzbank’s data visualizations across their entire mobile retail banking suite. This integration of SciChart’s native iOS and Android chart library will deliver faster, more accurate, and highly customizable data insights for millions of Commerzbank customers in Europe.
Commerzbank’s retail banking app will support interactive charting across devices, leading the bank’s digital first strategy. The bank will join J.P. Morgan as the next major financial institute to leverage SciChart in their customer-facing mobile products.
SciChart’s unique positioning as the only high-performance, hardware-accelerated native iOS and Android chart library will enable dynamic data visualization across generations of mobile phone technology. Customers can expect a seamless experience, whether viewing stock market trends, monitoring spending history, or analyzing personal finances.
Commerzbank clients will benefit from standardization across devices without slowdown, alongside enhanced data access. Native iOS (Swift) and Android (Android SDK, Kotlin) were chosen over JavaScript for mobile due to the inherent performance benefits and UX. This and more will help separate Commerzbank’s mobile offering from its competitors.
About SciChart: SciChart is the world’s fastest, precision data visualization charting library, used by top global companies in sectors ranging from healthcare and engineering to aerospace and finance. Offering cross-platform compatibility and full native support across WPF, JavaScript, iOS, Android and MacOS. SciChart is trusted for applications that demand speed and accuracy in real-time data analysis or performance across low-end devices and embedded hardware. SciChart is found everywhere, from the F1 racetrack, to NASA mission command centers and low-cost medical devices.
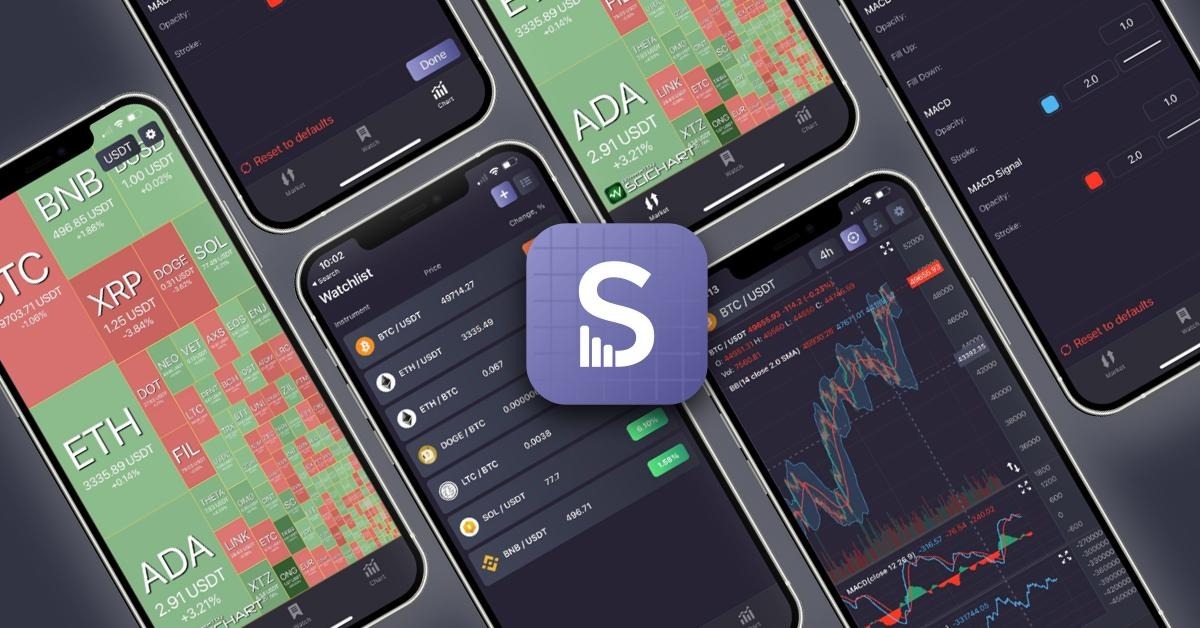
The SciTrader app is a showcase and demo application for financial applications on mobile. Download and explore the core functionality, which includes built-in accessibility, theming, and full financial dashboard creation.
What Are Retail Banking Applications?
Retail banking applications provide consumers with easy access to their personal finances via smartphones or tablets. Essential banking tasks, like checking balances, transferring money, and paying bills, can be done at any time without needing to visit a physical branch. They also support advanced features like managing loans, investments, and personal finance tools.
What Are the Key Benefits of Retail Banking Applications?
There are plenty of benefits of retail banking applications, and as more and more banks and financial institutions explore this avenue for their customers, it’s good to consider why and how these apps will improve the consumer experience while simultaneously supporting business goals.
Convenience: Apps offer 24/7 access to banking services, making it easier for users to manage their finances on the go.
Real-Time Access: Users receive up-to-the-minute data on their transactions and account balances, facilitating better financial oversight.
Data Visualization: Visual tools, such as charts and graphs, play a critical role in helping users understand spending patterns, monitor investments, and track financial goals. This enhances decision-making by simplifying complex data into intuitive, digestible formats.
Security: With advanced features like two-factor authentication and biometric logins, banking apps ensure secure transactions.
Personal Finance Management: Many apps include visual aids to categorize spending, create budgets, and monitor savings goals, further empowering consumers to manage their finances efficiently.
By incorporating data visualization, retail banking apps transform financial information into easily understandable visuals, helping users interpret trends and make informed financial decisions.
These apps deliver an all-in-one solution that combines convenience, security, and clarity for users’ financial management needs. Linked products include cryptocurrency trading apps, such as Binomo, and stocks and shares applications, such as Robin Hood.
Challenges Faced by Mobile Banking Applications in Data Visualization
As consumers become more demanding, expecting a digital-first, mobile solution, banking applications become more complex and data-rich, requiring efficient, accurate and user-friendly data visualizations. The sector faces unique challenges in UX to differentiate product offerings from competitors and provide value to consumers while working within the confines of the mobile technology environment.
1. Compatibility Across a Wide Range of Devices
Diverse Hardware: Mobile banking apps need to function across a broad spectrum of devices, from high-end smartphones with powerful processors to older, lower-spec models. This makes it difficult to ensure that charts render consistently and perform well across devices.
Operating System Fragmentation: With various versions of Android and iOS in use, ensuring that charting libraries and data visualizations behave uniformly across different OS versions is a constant challenge. Features that work on newer OS versions might fail on older ones, requiring additional testing and optimizations.
Screen Sizes and Resolutions: Mobile devices come in a wide range of screen sizes and resolutions, making it necessary to create responsive, scalable charts that provide a seamless experience, whether viewed on a compact smartphone or a tablet.
2. Performance Constraints
Touch and Gesture Support: Mobile devices rely on touch interactions like tapping, swiping, pinching, and zooming, which require different charting behaviors compared to desktop applications that rely on keyboard and mouse input. Ensuring that charts respond intuitively to these gestures while maintaining accuracy and fluidity is a core challenge.
Limited Input Space: Due to the smaller screen size, the interactive elements of charts, such as tooltips, legends, and buttons, need to be carefully designed so they don’t overwhelm the user interface but remain accessible and user-friendly.
3. Interaction Complexity
Touch and Gesture Support: Mobile devices rely on touch interactions like tapping, swiping, pinching, and zooming, which require different charting behaviors compared to desktop applications that rely on keyboard and mouse input. Ensuring that charts respond intuitively to these gestures while maintaining accuracy and fluidity is a core challenge.
Limited Input Space: Due to the smaller screen size, the interactive elements of charts, such as tooltips, legends, and buttons, need to be carefully designed so they don’t overwhelm the user interface but remain accessible and user-friendly.
4. Theming and Accessibility
Dark Mode and Theming: Many mobile users prefer dark mode, but switching between light and dark themes while ensuring that charts remain legible and aesthetically pleasing can be a challenge. Charts often contain fine details, and certain colors may lose contrast in dark mode, requiring custom adjustments.
Accessibility for Users with Disabilities: Ensuring charts are accessible for users with visual impairments or motor disabilities is vital. Features such as voice-over narration, zooming for clarity, and high-contrast mode need to be supported to meet accessibility guidelines like WCAG (Web Content Accessibility Guidelines).
5. Real-Time Data and Complexity
High-Frequency Data Updates: Although more aligned to commercial solutions instead of the retail market, financial applications often require real-time or near-real-time data updates, especially for market data and investment tracking. Managing these updates on mobile devices, especially with limited network bandwidth or unstable connections, poses significant technical hurdles.
Complex Data Sets: Users might expect to visualize large or complex datasets, such as historical financial data or detailed spending analysis. Rendering this data efficiently without sacrificing clarity or detail is challenging on mobile devices with limited resources.
Complex charting and real time updates on mobile leveraging SciChart
How SciChart’s Native iOS and Android Solutions Address These Challenges
From cross-platform integration to fast, real-time chart rendering, banking app providers can achieve a seamless experience for their end user while tackling the challenges of finance big data projects head-on.
1. Cross-Platform Compatibility
Optimized for iOS and Android: Native libraries are specifically designed for the nuances of each platform, ensuring seamless integration with both iOS and Android environments. This reduces the fragmentation issues often faced in mobile development and guarantees that charts function consistently across different OS versions and device types.
Responsive Design: SciChart supports automatic scaling and responsive layouts, ensuring charts render optimally on all screen sizes and resolutions. Whether on a compact smartphone or a tablet, charts are always clear and readable, making them ideal for the diverse devices used by banking customers.
2. High-Performance Rendering
Visual Xccelerator Rendering Engine: Theproprietary engine ensures fast, GPU-accelerated chart rendering, reducing the load on the CPU and improving performance, even on lower-end devices. It can handle real-time updates, processing millions of data points per second in WPF. This makes it suitable for financial applications that require up-to-date visualizations of live stock prices, transaction histories, currency exchange rates, or spending patterns.
Efficient Resource Management: SciChart is engineered to be memory-efficient, ensuring charts run smoothly without consuming excessive battery life or memory. This optimization makes it suitable for complex banking applications that need to balance performance with user experience.
3. Intuitive Mobile Interactions
Touch Gesture Support: Includes built-in support for touch gestures, such as pinch-to-zoom, drag-to-pan, and tap-to-select. These gestures are responsive and intuitive, allowing users to interact with financial data in a fluid and seamless manner. For example, users can zoom in on specific parts of a stock chart or tap to see more detailed data points.
Customizable Interactions: Developers have flexibility to create custom interactions, ensuring that user interfaces are optimized for mobile and can be tailored to the specific needs of the banking application.
4. Theming and Accessibility
Dynamic Theming Support: SciChart natively supports dark mode and custom themes, allowing developers to easily switch between light and dark with optimum visual clarity and contrast. Gridlines and labels can be modified dynamically to suit any color scheme.
Accessibility Features: Charts can be configured to meet accessibility standards, with options for larger labels, tooltips, and high-contrast settings, ensuring users with disabilities can interact with charts without difficulty. Custom tooltips and labels can also be designed to work with screen readers for users who rely on voice-over technology.
5. Real-Time Data Handling
Efficient Real-Time Updates: SciChart is designed to handle real-time data feeds efficiently, making it ideal for financial applications that require frequent updates, such as live market data or currency exchange rates. SciChart’s rendering engine ensures that these updates are processed smoothly, without freezing or slowing down the app, even when dealing with large datasets.
Large Dataset Support: Whether displaying years of transaction history or detailed investment data, SciChart can manage large datasets—millions of data points and hundreds of series—without losing performance. This makes it well-suited for banking apps that need to visualize vast amounts of financial data in a meaningful way.
Complex Visualizations: Supported by the bolt-on SciTrader, SciChart supports complex financial charting out of the box, including existing APIs to build detailed financial dashboards on mobile for everything from live trading on mobile to deep dives into financial history data.
Financial Data for Mobile Banking Applications
Whether you’re looking to present simpler retail market financial data on mobile, or build out the next trading platform to rival TradingView, SciChart enables clients to create pioneering data visualizations across devices. Catering from everything from the entire retail banking application for J.P. Morgan and Commerzbank to LSEGs Eikon platform, SciChart has solutions ranging from OHLC charts to live trading indicators all the way to customizable pie charts to visualize personal spend history.
Chief Commercial Officer at SciChart, with a background in Biochemistry & Genetics and serving as a Government Scientific Grant Assessor. Focuses on business development, building key partnerships, advancing customer innovations, leading educational programs, and managing reseller networks.
Queens Award for Innovation Proud winners of the Queens Award for Innovation, 2019. Awarded on account of our innovative graphics engine which underpins the SciChart library and enables our world-beating charting performance
National Business Awards Highly Commended for Lloyds National Business Awards, 2019. Awarded on account of our innovative graphics engine and impressive customer base
National Technology Awards Awarded “Healthcare Tech of the Year” at the 2025 National Technology Awards – a top UK recognition for breakthrough innovation in technology.
Reviews SciChart has received hundreds of verified, 3rd party reviews
Try SciChart Today
Start a trial and discover why we are the choice of demanding developers worldwide