SciChart, a supplier to all leading Formula One teams, has been selected for a novel wind tunnel data visualization project to deliver the next generation of aerodynamic changes to the upcoming season’s vehicles.
F1 technical regulations in 2022 emphasized downforce and airflow, making aerodynamics a vital part of technology evolution. As a result, wind tunnel testing became the most important development tool in the sector.
Cross-platform solutions, including JavaScript and WPF, will be leveraged to undertake deep data analysis in controlled environments to evaluate design changes and atmospheric impacts on vehicular performance.
Wind tunnel use is restricted in Formula 1 by the FIA regulations. Under the new sliding scale model, teams are restricted to the number of wind tunnel testing runs and computational fluid dynamics (CFD) hours they can do, based on their current performance. It’s thought this will help level the playing field and provide less predictability for racing teams. However, even with these new restrictions, teams can build resilience with the right systems.
SciChart was selected from a complete market analysis based on interactivity and performance to deliver on a complex real-time aerodynamics requirement. Due to the restricted use model, SciChart will be leveraged to build novel high-performance precision interfaces. The data extracted will provide exciting insights to fuel vehicle design on the track.
About SciChart: SciChart is the world’s fastest, precision data visualization software, used by top global companies in sectors ranging from healthcare and engineering to aerospace and scientific research. Offering cross-platform compatibility, precision rendering, and unparalleled performance, SciChart is trusted for applications that demand speed and accuracy in real-time data analysis. SciChart is found everywhere from the F1 race track, to NASA mission command centers and pioneering research.
How SciChart is Enabling Wind Tunnel and Aerodynamic Projects
Used by all leading F1 teams, Nascar, and automotive market leaders, SciChart is a data visualization solution for real-time telemetry, lap analysis, aerodynamics, and signal processing. SciChart specializes in charting for pit strategy software, powertrain optimization, ECU, and engine design across design, emulation, and test undertaking consultancy projects in this sector.
SciChart is specifically designed to handle these complexities, making it an ideal solution for visualizing and analyzing wind tunnel and aerodynamic data.
Why is Wind Tunnel Data Complex?
Wind tunnel testing is essential in industries like motorsport, aerospace, and automotive, where optimizing aerodynamic performance is critical.
Projects that utilize wind tunnels face unique challenges due to the complex nature of the data involved. Wind tunnel testing generates vast and intricate datasets. This includes:
- Aerodynamic forces (lift, drag, and side force) that help optimize speed and handling.
- Pressure distribution data across the vehicle’s surface to visualize airflow patterns.
- Force and moment coefficients (CL, CD, and CM) that measure lift, drag, pitch, roll, and yaw moments.
- Wheel and tire data that captures the impact of rotating elements on aerodynamics.
- Environmental conditions like wind speed, temperature, and density that affect aerodynamic forces.
Handling and visualizing this data in real-time is critical for making quick, informed adjustments to improve vehicle performance in motorsport aerodynamics, but also aircraft aerodynamics and military wind tunnels.
The datasets are often large and must be rendered without lag, making performance and accuracy essential. SciCharts proprietary 64-bit rendering engine means that accuracy and performance are guaranteed.
The Charts Powering Aerodynamics Dashboards across Motorsport, Automotive & Aerospace

SciChart offers a range of chart types specifically tailored to visualize wind tunnel data, including:
- Force vs. speed graphs to track aerodynamic forces like downforce and drag.
- Coefficient graphs to plot variables like lift and drag coefficients against yaw or pitch.
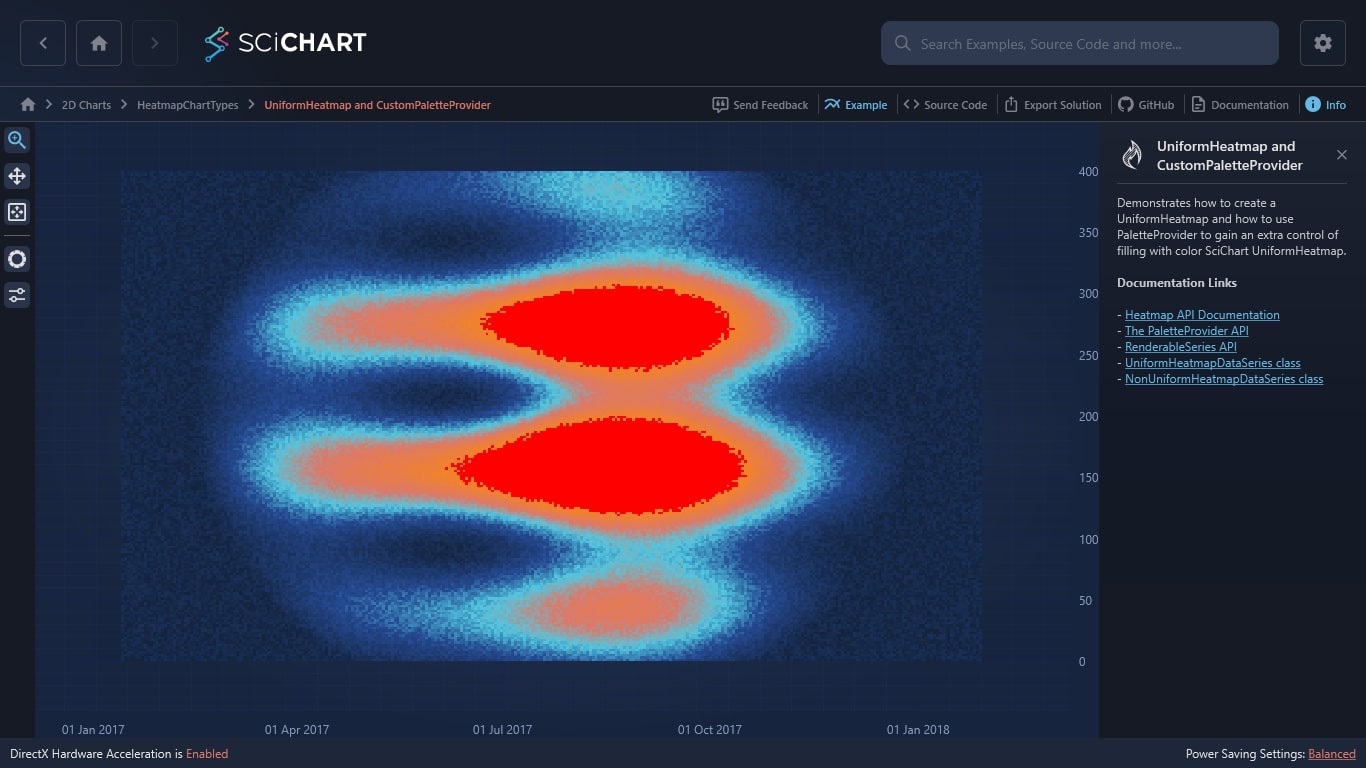
- Contour plots and heatmaps for real-time pressure distribution visualization.

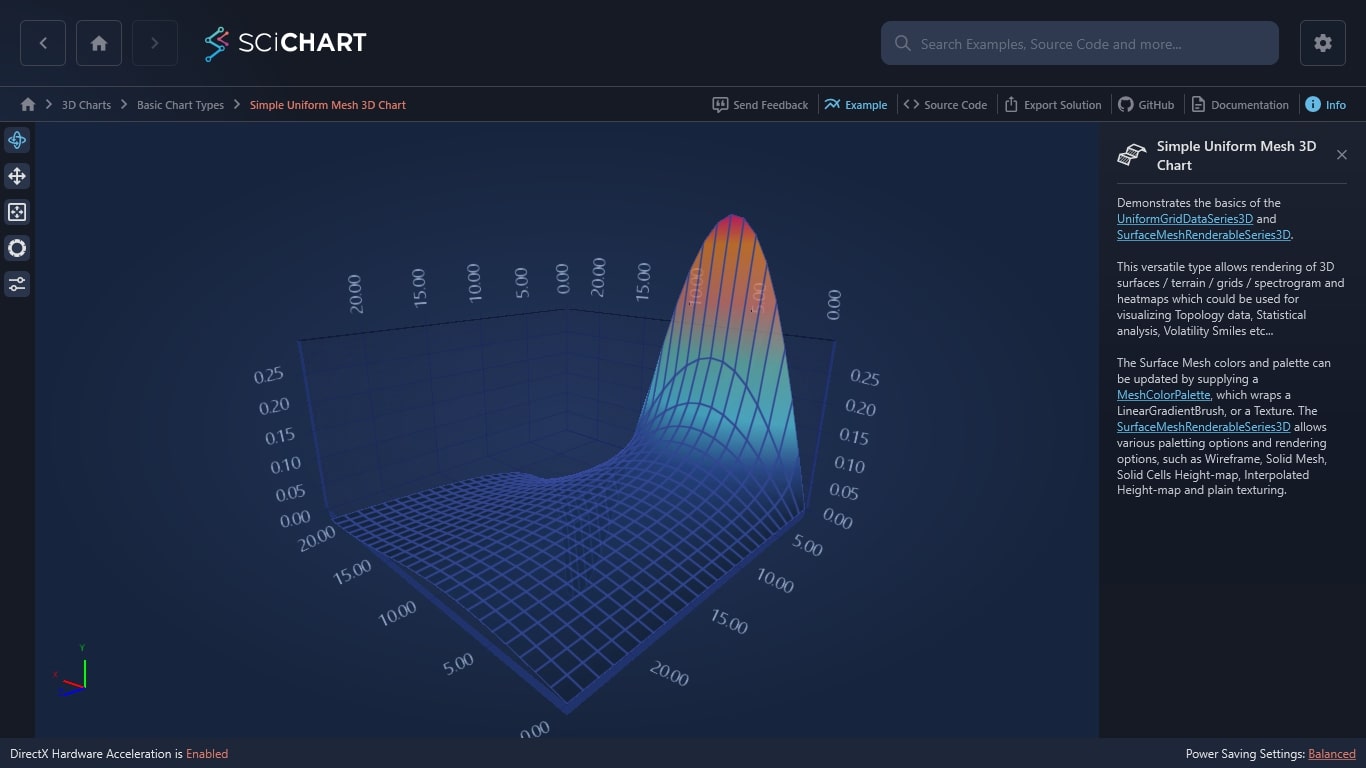
- 3D surface plots to view airflow around the vehicle in 3D.

- Polar plots to demonstrate the trade-offs between drag and downforce in real-time.

Data Customization with SciChart
SciChart’s advanced rendering engine enables multi-chart type dashboards, detailed annotations, bespoke overlays, and heatmaps for aerodynamics all in real-time from multiple data sources. Our expansive API puts you in the driver’s seat of your data sets, providing unmatched flexibility and customizations.
The extensive customization options enable engineers to:
- Synchronize multiple charts for a comprehensive view of data.
- Customize axes, data streams, and chart surfaces.
- Integrate real-time data feeds, allowing engineers to interact with live datasets during testing.
SciChart’s high-performance GPU-accelerated rendering ensures smooth, real-time visualization of millions of data points. For aerodynamic projects, where large datasets need to be processed instantly, this is crucial. Thanks to its support for both 2D and 3D visualization, teams can flexibly analyze everything from pressure gradients to airflow dynamics. Our cross-platform solution allows deployments across hardware, meaning decentralized teams can still offer their expertise remotely.
Data Visualization solution for Aerodynamic Dashboards
SciChart powers aerodynamics and wind tunnel projects in the aerospace, defense, and automotive sectors by offering high-performance data visualization solutions. With real-time analysis of wind tunnel data such as pressure distribution, drag reduction, and downforce optimization, SciChart provides advanced tools for simulation integration and aerodynamic modeling.
Whether it’s enhancing aerodynamic performance in Formula 1, improving aircraft stability in aerospace, or conducting defense wind tunnel testing for military vehicles such as UAVs, SciChart enables fast, accurate insights through multi-channel visualization and customizable charts. This ensures critical data from aerodynamic testing is handled efficiently, driving innovation across all sectors
Related Posts
