SciChart for Avalonia XPF v2.0 Released!
SciChart is thrilled to announce the release of SciChart for Avalonia XPF 2.0 – a major update that brings all features and improvements […]
Just over four months since the our last major release, today we have an exciting announcement of a HUGE step forward in JavaScript Chart Performance in our latest release: SciChart.js v5
In this release we’ve focused mostly on performance. Our userbase has demanding requirements from F1 to medical dashboards, IoT telemetry in industrial, aerospace and defense applications and as a result, our team has worked hard over the past few months to make this the leanest, fastest and most feature rich version of SciChart yet.
Find out what’s new below!
SciChart.js v5 and above is now compiled with wasm-simd. This enables our graphics engine to use 128-bit SSE Single Instruction Multiple data registers on Intel, AMD and ARM hardware on Windows, macOS, iOS, Android and Linux allowing parallelization on-chip for performance-critical algorithms and maths functions.
Wasm-simd is portable, and works on all modern browsers (see caniuse.com) including Chrome, Edge, Safari, Firefox, Opera, Chrome for Android, Safari iOS, Samsung Internet, Android Browser and Firefox for Android. SciChart.js autodetects wasm-simd support in your browser and a fallback to -nosimd has been included for the rare edge cases that do not support this enhancement.
Adding Wasm-simd support results in a >2x-4x performance boost for big-data charts in SciChart.js v5, as key algorithms such as resampling and AutoRange (axis autofitting) benefit from parallelization on chip. This change applies automatically and no changes to your code need to be made to make use of the wasm-simd enhancement, and a fall-back requires minimal configuration (see simd documentation)
We identified several areas of redundancy in the *.wasm (WebAssembly) file that is bundled with SciChart.js and managed to strip unnecessary code, reducing the file-size of scichart2d.wasm and scichart3.wasm by 1 Megabyte (each)! SciChart.js v5 now has a 45% smaller wasm file size than before, resulting in faster download time, faster compilation & initialization of wasm.
The JavaScript bundle size has been shrunk marginally by ~150kb making index.min.js just 1.9MBytes. Further improvements are on the horizon such as using more optimal bundlers and stripping redundant code as there is a significant amount of redundancy in the JS files.
By stripping unnecessary code in the C++ compiled to WebAssembly, we’ve also streamlined the initialisation process. The initialisation time of SciChart.js v5 is now up to 300ms faster for the first chart shown: a one-time setup cost which requires initialisation of the 2D/3D engine and text rendering subsystems in our chart library. Subsequent charts are rendered quickly & immediately (sub 10ms load) as before. The time to render the first chart is now as little as 250ms for “empty cache hard reload” depending on your configuration & settings.
See Performance tips and tricks for help optimising SciChart for your use case.
We regularly carry out a suite of performance tests on SciChart.js vs. earlier versions and competitors. Download this test suite for yourself from this github repo. You can see some details in the post: JavaScript Chart Performance Comparisons.
In v5 of SciChart.js we’ve achieved the following impressive performance improvements vs. our previous version SciChart.js v4:
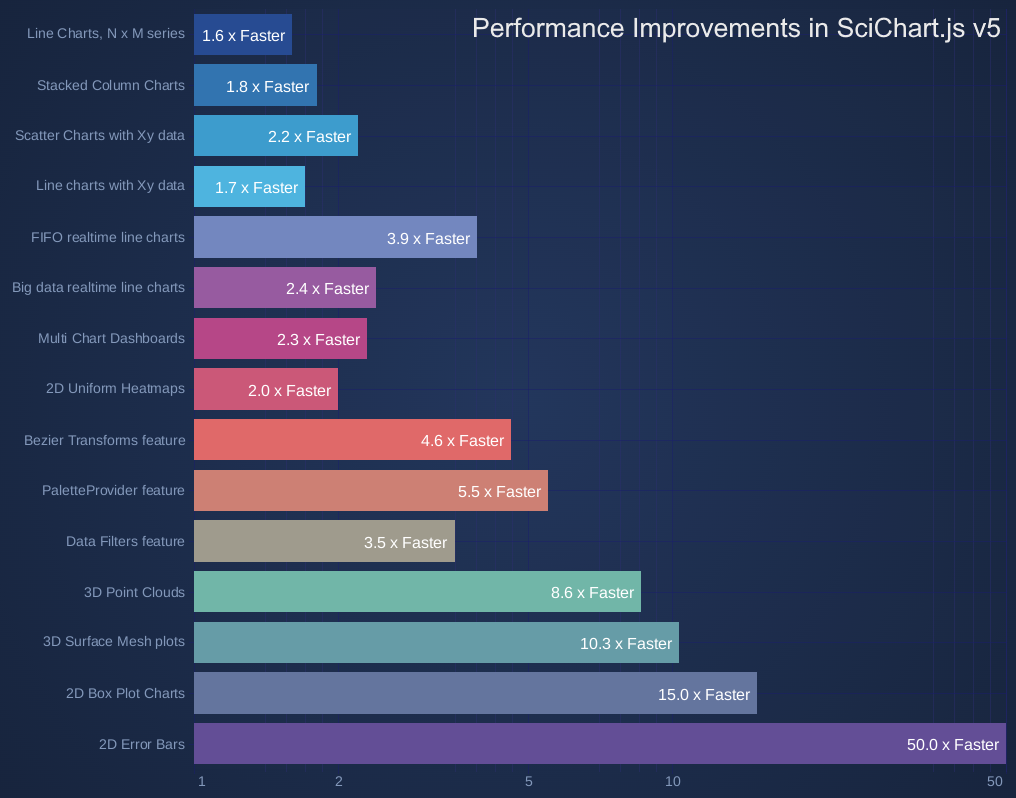
It’s not just the main chart types that have gained a performance boost. By using vectorToArrayView functions added to SciChart.js in v4.0, we were able to apply micro-optimisations throughout the library, resulting in considerable performance improvements to extensions and features that are often added to complex dashboards. PaletteProviders (per-point colouring), DataLabels, Serialization, Datapoint selection, Series animations, Rectangle / Triangle series, Hit-test features used by tooltips and selection modifiers have all benefitted from performance improvements using this technique.
Other micro-optimisations have also been applied to DataSeries to allow for faster manipulation of Xy, Xyz, and 2D/3D data formats. Heatmaps and 3D surface plots, 3D point cloud charts now benefit from Float64Array support. Metadata handling has been optimised in 3D charts. For example: creation, Appending and insertion of points into XyzDataSeries3D is now 50x faster and rendering of a 3D scatter or point-cloud chart with metadata per-point colouring is now 10x faster.
Finally, we’ve also streamlined the shader pipeline to have massively simplified shaders enabling faster rendering performance on lower-powered GPU hardware. This will benefit users deploying SciChart.js v5 to SBC (Single Board Computers) in industrial, embedded hardware or IoT environments.
We’ve reduced the memory footprint of the SciChart library in many cases. Memory is more stable, with fewer allocations/deallocations while rendering charts, and one memory leak has been fixed, resulting in marginal improvements in memory usage. For example: for a Scatter Series with 1M points, SciChart.js v5 now uses 40% less memory vs. SciChart.js v4.
In addition, by compiling with the flag -s MAXIMUM_MEMORY=4GB we’ve increased the upper limit for memory that can be reserved by the browser in SciChart.js’ WebAssembly engine to 4GB (previously was 2GB) allowing for extremely big data charts and by-passing the max memory limit of ~2GB in Google Chrome.
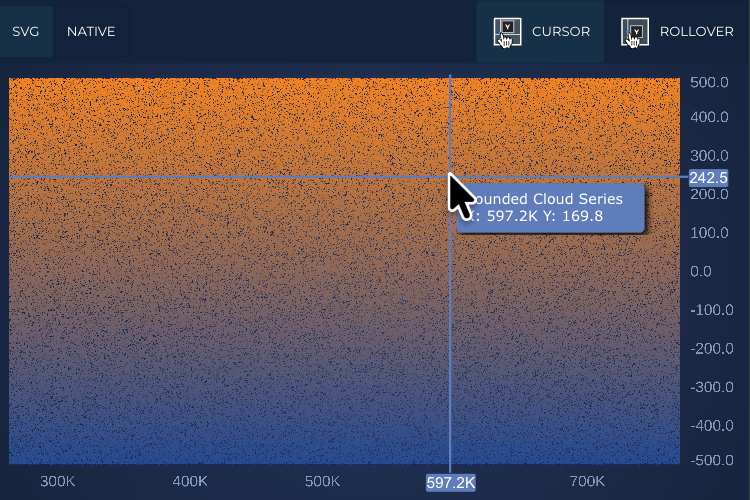
Where updates only affect chart elements drawn with svg, these are now applied without redrawing the rest of the chart. Rollover, Cursor and VerticalSlice modifiers have been updated to be pure svg to take advantage of this, resulting in dramatic improvements when using tooltips over large static datasets.
This new axis type uses a set of base values, potentially independent from series data, to determine the axis scale. This allows for various non-linear axis configurations, such as Log-linear and dynamic zoom.

BaseValueAxis Documentation
This axis extends BaseValueAxis and is configured especially for use with financial data that contains gaps, such as stock markets which do not trade on weekends. This axis collapses those gaps like a category axis, but still plots data by x value, allowing for series with varying numbers of points, or series with duplicate x values as shown in this demo:
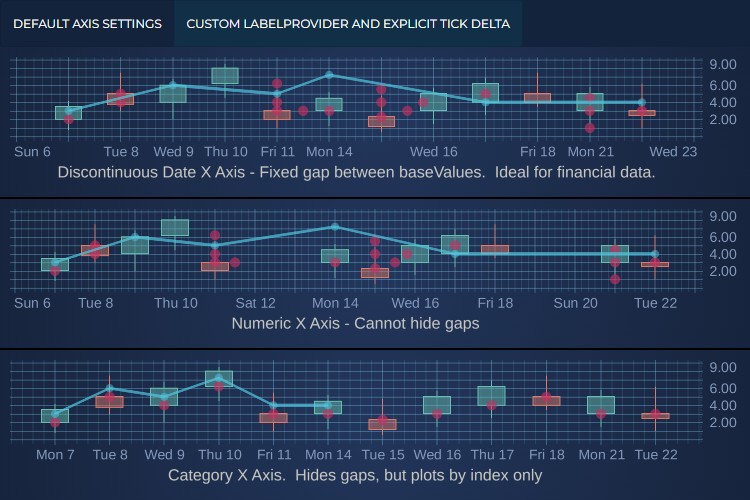
DiscontinuousDateAxis Documentation
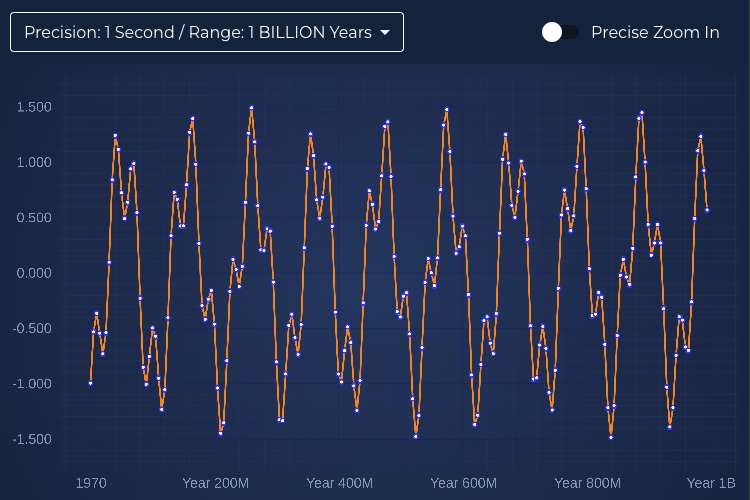
The SmartDateLabelProvider has been updated with new formatting options and the ability to format dates and times from years down to nanoseconds. We improved the api making it easy to override and use other formatting libraries. This new demo showcases the range and precision possible with SciChart because we retain 64bit precision right down to the coordinate calculation.
This event fires in the middle of the render process, once all axes have been measured and sized, but before anything is drawn. Modifiers can update at this point, perform hit-tests and update the position of annotations which are then drawn on the same frame, rather than the next one.
These new events make it even easier to produce responsive charts and to measure performance accurately. See the full list of events and how to use them in the Render Events documentation.
This allows metaData to be used in tooltips in 3d on all series types.
3D Chart Styling Documentation
A new option disableEngineLoop has been added to SciChartSurface.create() and SciChart3DSurface.create() which allows to disable scichart.js drawing loop in case of using an external one.
Manual rendering documentation
For the most part, SciChart.js v5 is a drop-in replacement for v4. We have had to bump the major version however due to some breaking changes which may affect some users. These are documented at breaking-changes-v4-v5
In summary these are:
Contact us to learn more
SciChart.js is a JavaScript Chart Library designed for complex, mission critical applications. Now with a FREE community edition. If you have a question or would like to learn more about our products & services, please contact us:
Related Posts
![]()
Queens Award for Innovation
Proud winners of the Queens Award for Innovation, 2019. Awarded on account of our innovative graphics engine which underpins the SciChart library and enables our world-beating charting performance
![]()
National Business Awards
Highly Commended for Lloyds National Business Awards, 2019. Awarded on account of our innovative graphics engine and impressive customer base
![]()
National Technology Awards
Awarded “Healthcare Tech of the Year” at the 2025 National Technology Awards – a top UK recognition for breakthrough innovation in technology.

Reviews
SciChart has received hundreds of verified, 3rd party reviews