Read on to see how The University of Manchester Research IT’s Mobile Development Service (MDS) implemented SciChart to understand users’ sleep and activity pattern in real-time.
Platform: iOS and Android
Industry: Research, Education
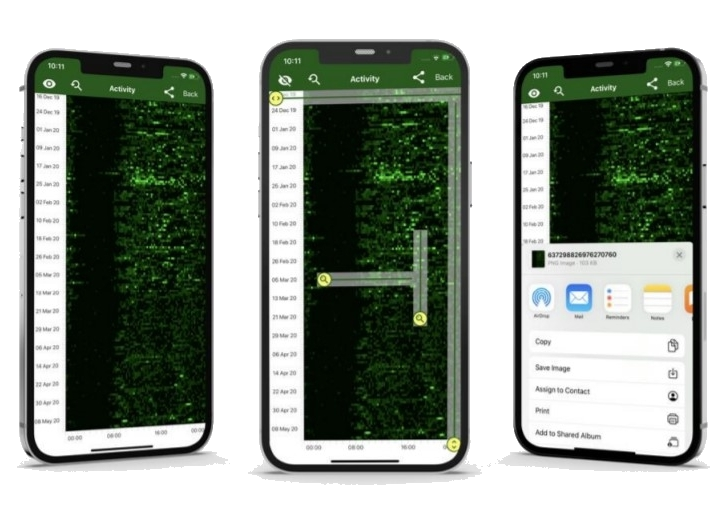
RAPapp is an application that allows users to send their sleep and activity data measured by their smart watches or fitness tracker to university researchers.
Challenge: To understand how the lockdown in 2020 had affected the general public and the EEA countries, the Mobile Development Service (MDS) team had challenges finding a high-performance charting tool that displays heatmaps in the exact style and speed their researchers asked for.
Solution: The MDS team used SciChart to successfully visualise about 2-years’ worth of steps sorted into 15-minute bins – around 70,000 data points. In addition to this, the integration of SciChart enabled users to view their sleep and activity heatmap in real-time – giving users insight into their daily activity during the lockdown.
