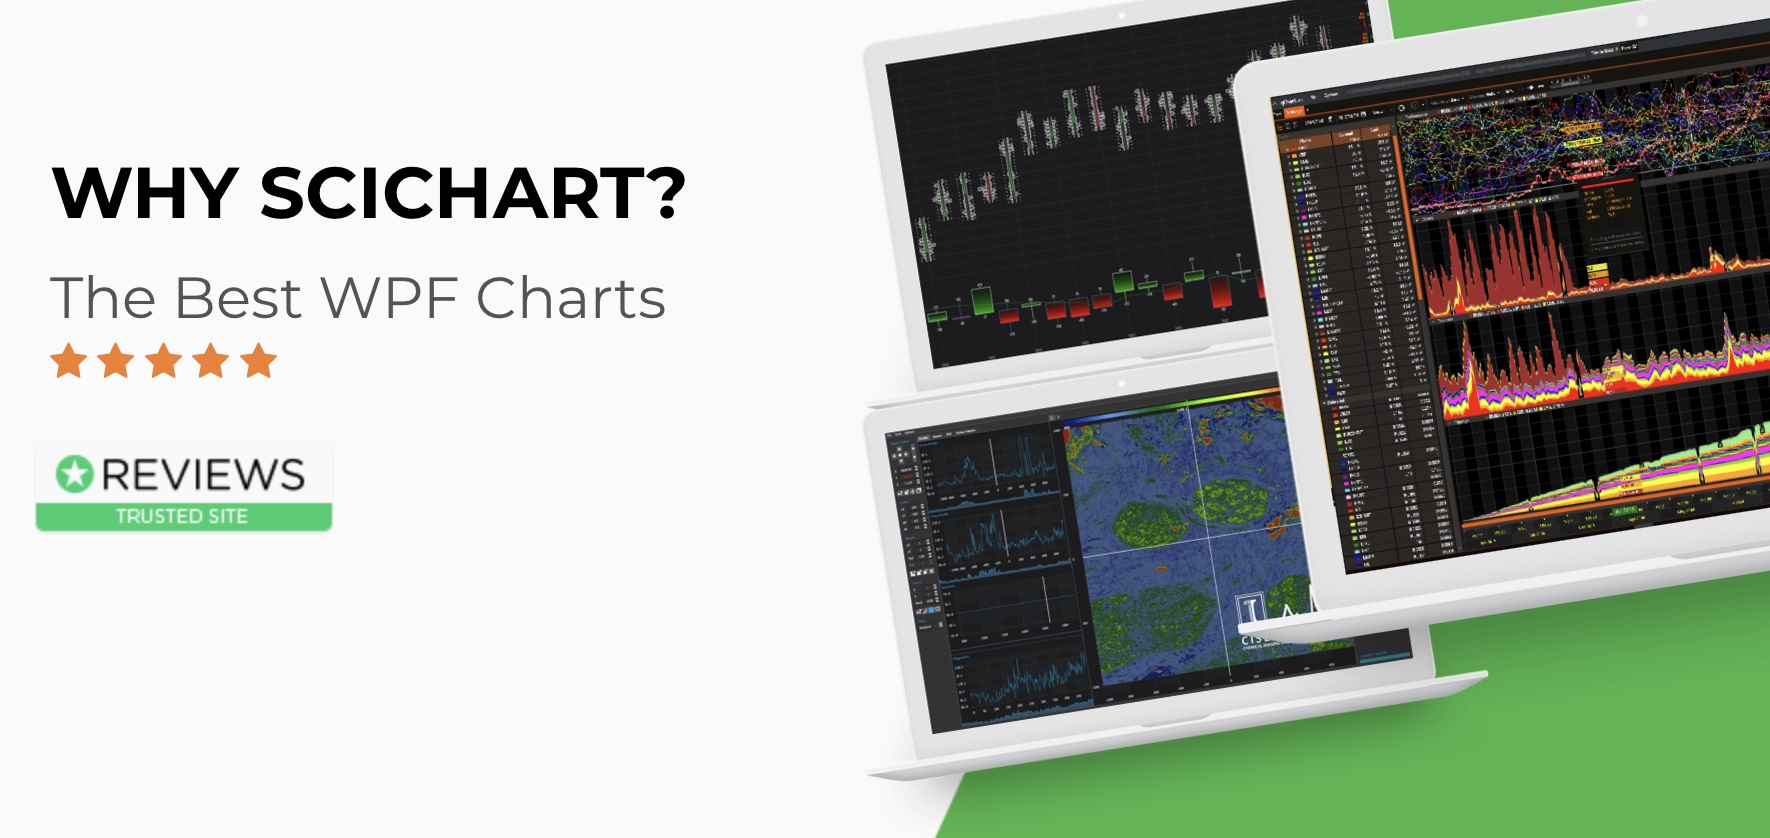
It’s hard to believe, but this month in March 2019, SciChart WPF is 7 years old!
Version 1.0 of SciChart WPF was coded in a spare room, first released in March 2012, and was the first WPF Chart control in the world to incorporate fast, immediate-mode drawing (bitmaps) into XAML based WPF Chart controls. This literally changed the market & made previously impossible projects become possible, because at the time existing WPF charts were not able to draw large datasets, or update fast or in realtime.
A performance comparison published in 2012 by Scott Logic showed how far SciChart and one other competitor at the time (Visiblox, now discontinued) outpaced the market in terms of chart performance: both competing for the title of ‘fastest WPF Chart’ with high drawing speed and efficient memory usage.
Fast forward to 2019, SciChart is now a feature-rich, XAML/MVVM capable WPF Chart control, capable of drawing many millions of points in realtime, with dynamically updating charts, and used by thousands of developers worldwide.
Our users consistently rate us 5-stars and report that they believe we provide the Best WPF Chart control on the market.
So, for our seventh anniversary we would love to share with you: reasons why SciChart makes the Best WPF Charts.
Please read more at the article below!
Read: Why SciChart, the Best WPF Chart
Finally, a huge thank you to our customers for making SciChart what it is today! We wouldn’t have done it without your feedback, trust in our company and support.
Best regards,
Andrew
[SciChart Team]
Related Posts
