Read on to see how a cutting-edge research project at the University of Illinois used SciChart to display Realtime High Definition Heatmaps from Quantum Cascade Laser (QCL) Infrared (IR) Spectroscopy surpassing Table-top Fourier Transform IR (FT-IR) technology.
Platform: WPF
Industry: Scientific, Infrared Spectroscopy
The University of Illinois departments of Bioengineering, Mechanical Science & Electrical Computer Engineering were researching alternatives to FT-IR for use in Medical Diagnostics. Despite exponential growth of the field and its world-wide research, the clinical sphere has been limited by data management. With over a 100 million data points generated in Realtime current imaging technologies were limited to less than 1% of the data set.
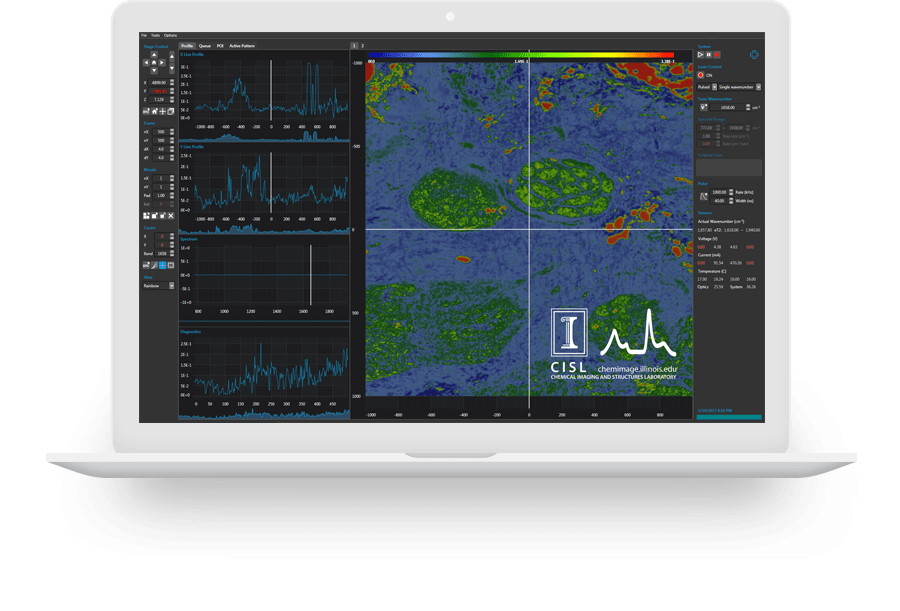
Challenge: To display accurate Realtime charts from Fast Infrared Chemical Imaging for high-definition, high Data sets onto heatmaps and line charts. Data is collected from QCL spectrometers and displayed both for development and end-users.
Solution: SciCharts High Performance WPF charts were used to handle over 1million points of data in Realtime with the capacity to increase up to 10 million. Custom annotations were implemented via SciChart’s Rich Core WPF charting API to generate overlaid line annotations and show cursor position and information. This allowed the advent of HD Realtime IR imaging.
