
The Box Plots Type
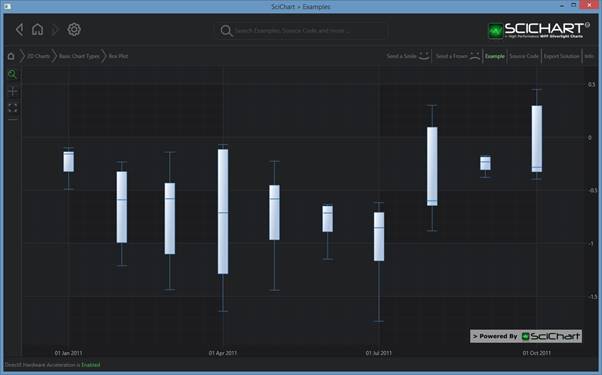
Box Plots or Statistical Plots are provided by the FastBoxPlotRenderableSeries type. This accepts data from a BoxPlotDataSeries and renders the body, median, upper and lower as follows:
Examples for the Box Plot Chart can be found in the SciChart WPF Examples Suite which can be downloaded from the SciChart Website or our SciChart.WPF.Examples Github Repository.
NOTE: For info about BoxPlotDataSeries, as well as other DataSeries types in SciChart, see DataSeries API
To declare a FastBoxPlotRenderableSeries, use the following code:
Declare a FastBoxPlotRenderableSeries in Xaml / Code Behind
| Declare a FastBoxPlotRenderableSeries |
Copy Code |
|---|---|
<!-- where xmlns:s="http://schemas.abtsoftware.co.uk/scichart" --> <s:SciChartSurface> <s:SciChartSurface.RenderableSeries> <s:FastBoxPlotRenderableSeries x:Name="rSeries" Stroke="SteelBlue"> <s:FastBoxPlotRenderableSeries.BodyBrush> <LinearGradientBrush StartPoint="0,0" EndPoint="0.5,1"> <GradientStop Offset="0" Color="White"/> <GradientStop Offset="1" Color="LightSteelBlue"/> </LinearGradientBrush> </s:FastBoxPlotRenderableSeries.BodyBrush> </s:FastBoxPlotRenderableSeries> </s:SciChartSurface.RenderableSeries> <!-- XAxis, YAxis omitted for brevity --> </s:SciChartSurface> // Code Behind, e.g. in OnLoaded event handler, set the DataSeries var boxPlotDataSeries = new BoxPlotDataSeries<double, double>(); // Assuming X,Y values have been declared as lists of doubles boxPlotDataSeries.Append(xValues, medianValues, minimumValues, lowerQuartileValues, upperQuartileValues, maximumValues); rSeries.DataSeries = boxPlotDataSeries; | |
Declare a FastBoxPlotRenderableSeries in Pure Code
| Declare a FastBoxPlotRenderableSeries |
Copy Code |
|---|---|
// Declare the scichartsurface var sciChartSurface = new SciChartSurface(); // ... // Declare and add a Error Bars Series var rSeries = new FastBoxPlotRenderableSeries() { Stroke = Colors.SteelBlue, BodyBrush = new SolidColorBrush(Colors.LightSteelBlue), AntiAliasing = true, DataPointWidth = 0.8, StrokeThickness = 1, }; // Set some data var boxPlotDataSeries = new BoxPlotDataSeries<double, double>(); // Assuming X,Y values have been declared as lists of doubles boxPlotDataSeries.Append(xValues, medianValues, minimumValues, lowerQuartileValues, upperQuartileValues, maximumValues); rSeries.DataSeries = boxPlotDataSeries; | |
NOTE: You can also declare RenderableSeries using SciChart MVVM API (Series ViewModels). Please see MVVM DataSeries / RenderableSeries API for more details.