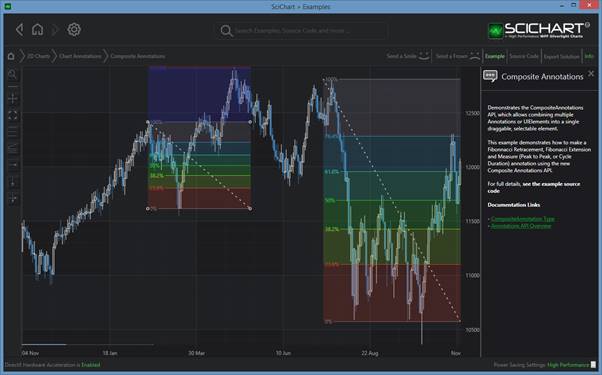
The Annotations API now features a CompositeAnnotation type, which you can derive from to create your own composite annotations (Annotations composed of many annotations). These are useful if you wish to draw more complex annotations consisting of many UIElements.
The CompositeAnnotation API Overview
CompositeAnnotations are created as follows:
- You need to create a class which inherits CompositeAnnotation
- In the CompositeAnnotation.Annotations collection, you may provide one or more child annotations.
- All must have CoordinateMode=Relative
- You can provide X1,X2,Y1,Y2 coordinates as relative values (0.0 – 1.0), meaning relative to parent annotation.
3. Your CompositeAnnotation class can now be added to the SciChartSurface.Annotations collection and treated like any other annotation.
Creating a CompositeAnnotation: Worked example
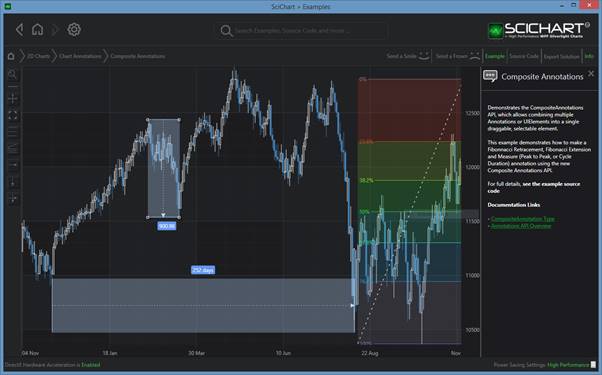
The following worked example demonstrates the MeasureXAnnotation: This draws a horizontal arrow with label measuring the difference between XMin and XMax.
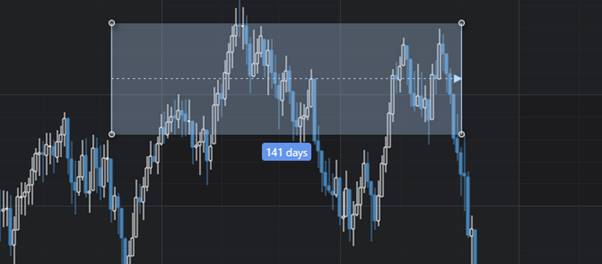
The MeasureXAnnotation is included as source-code in the 2D Charts > Chart Annotations > Composite Annotations Example. It is intended from these exampels that you are able to derive your own Composite Annotations. You can also use ours!
The visual aspect of the MeasureXAnnotation is declared in XAML. Here we have a background, LineArrow, as well as two lines (the left/right edges) and a Label showing the measurement value. Notice how the child annotations are set on the parent CompositeAnnotation.Annotations collection, and all have CoordinateMode=Relative, and relative coordinates set.
| Creating a CompositeAnnotation |
Copy Code |
|---|---|
<s:CompositeAnnotation x:Class="SciChart.Examples.Examples.AnnotateAChart.CompositeAnnotations.MeasureX.MeasureXAnnotation" xmlns="http://schemas.microsoft.com/winfx/2006/xaml/presentation" xmlns:x="http://schemas.microsoft.com/winfx/2006/xaml" xmlns:s="http://schemas.abtsoftware.co.uk/scichart" Canvas.ZIndex="1"> <s:CompositeAnnotation.Annotations> <s:BoxAnnotation Background="#FFBADAFF" CoordinateMode="Relative" Opacity="0.3" X1="0" X2="1" Y1="0" Y2="1" /> <s:LineArrowAnnotation CoordinateMode="Relative" Stroke="#FFBADAFF" StrokeDashArray="2,4" StrokeThickness="1" X1="0" X2="1" Y1="0.5" Y2="0.5" /> <s:LineAnnotation CoordinateMode="Relative" Stroke="#FFBADAFF" StrokeThickness="1" X1="0" X2="0" Y1="0" Y2="1" /> <s:LineAnnotation CoordinateMode="Relative" Stroke="#FFBADAFF" StrokeThickness="1" X1="1" X2="1" Y1="0" Y2="1" /> <s:TextAnnotation x:Name="MeasureText" Background="CornflowerBlue" CoordinateMode="Relative" CornerRadius="3" Foreground="White" HorizontalAnchorPoint="Center" X1="0.5" Y1="1"/> </s:CompositeAnnotation.Annotations> </s:CompositeAnnotation> | |
The Code-behind is where we calculate the text value for the TextAnnotation named MeasureText. We do this by overriding the AnnotationBase.Update method, which is called when the annotation is placed, and calculating the distance between XMin and XMax. Finally, the MeasureText.Text value is updated accordingly.
| Creating a CompositeAnnotation |
Copy Code |
|---|---|
public partial class MeasureXAnnotation : CompositeAnnotation { public MeasureXAnnotation() { InitializeComponent(); } public override void Update(ICoordinateCalculator<double> xCoordCalc, ICoordinateCalculator<double> yCoordCalc) { base.Update(xCoordCalc, yCoordCalc); if (Y1.CompareTo(Y2) > 0) { MeasureText.VerticalAnchorPoint = VerticalAnchorPoint.Top; MeasureText.Margin = new Thickness(0, 5, 0, 0); } else { MeasureText.VerticalAnchorPoint = VerticalAnchorPoint.Bottom; MeasureText.Margin = new Thickness(0, -5, 0, 0); } var range = X1.CompareTo(X2) > 0 ? RangeFactory.NewRange(X2, X1) : RangeFactory.NewRange(X1, X2); var categoryCalc = xCoordCalc as ICategoryCoordinateCalculator; if (categoryCalc != null) { var indexRange = (IntegerRange)range; var difference = categoryCalc.TransformIndexToData(indexRange.Max) - categoryCalc.TransformIndexToData(indexRange.Min); MeasureText.Text = string.Format("{0:dd} days", difference); } else { MeasureText.Text = range.Diff.ToString(); } } } | |
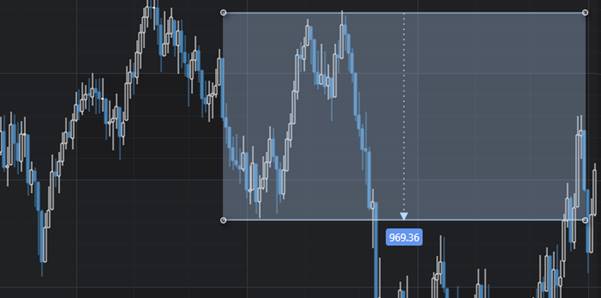
MeasureYAnnotation: Peak to Peak or Y-Direction Measurement Annotation
An example of how to create an Y-Measurement Annotation is included in the 2D Charts > Chart Annotations > Composite Annotations Example. This draws a vertical arrow with label measuring the difference between YMin and YMax.
Note: The code is very similar to the MeasureXAnnotation, so we have omitted it here for brevity. You can see the full source-code in the Composite Annotations Example in the WPF Examples Suite.
FibonacciRetracementAnnotation
An example of how to create an Fibonacci Retracement / Extension Annotation is included in the 2D Charts > Chart Annotations > Composite Annotations Example. These draw typical Fibonacci Retracements / Fibonacci Extensions by composing HorizontalLineAnnotation, BoxAnnotation and LineAnnotations into a parent CompositeAnnotation.