DirectX Compatibility in WPF Charts with SciChart
SciChart now features an optional DirectX10 based renderer. This is currently included as an add-on to the SciChart High Performance […]
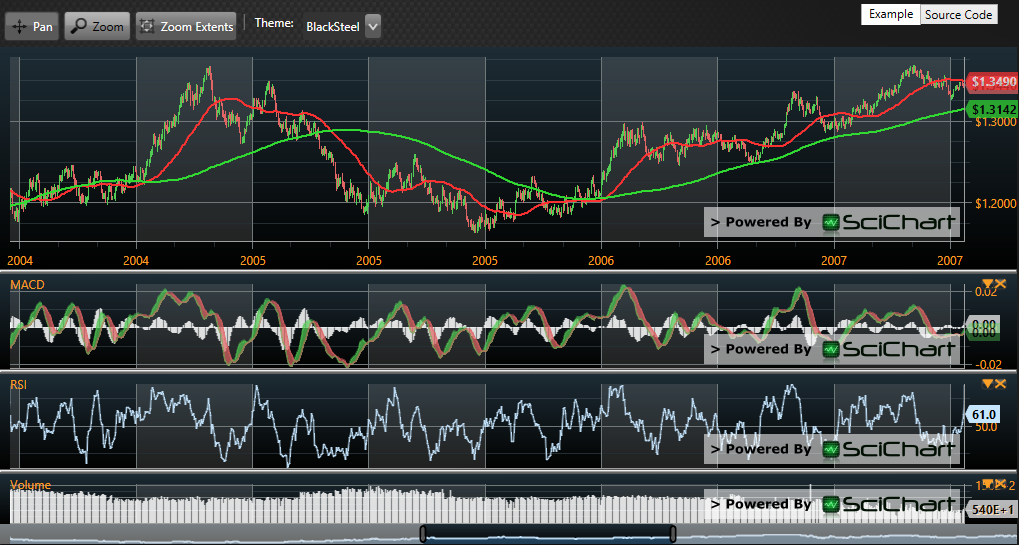
A frequently asked question at SciChart is how can I add a SciChartOverview to a Multi-paned Stock Chart hosted by SciChartGroup.
We already have a documented workaround for v2.x or later to add a SciChartOverview to appear under the last chart in an ItemsControl. This works fine for ItemsControls, but it won’t work with SciChartGroup.
Below, we present a way to add a Scrollbar to the SciChartGroup (multi-paned stock charts) using the new v3.2 ScrollBar API:
Why is this so hard? Well the SciChartGroup inherits the WPF ItemsControl. The actual charts are generated by the SciChartGroup.ItemTemplate. There is no reference to these charts at runtime, yet a SciChartOverview needs to bind to a parent surface.
So this code below, isn’t going to work:
[xml]
<!– This won’t work … –>
<Grid>
<Grid.RowDefinitions>
<RowDefinition Height="*"/>
<RowDefintion Height="Auto"/>
</Grid.RowDefinitions>
<!– ItemsControl bound to N Viewmodels, with ItemTemplate showing one chart per view model –>
<!– Note: SciChartGroup is an ItemsControl so the same problem applies to multi-paned stock charts –>
<ItemsControl Grid.Row="0" ItemsSource="{Binding ChartPaneViewModels}">
<ItemsControl.ItemTemplate>
<s:SciChartSurface x:Name="sciChart">
<!– Omitted for brevity –>
</s:SciChartSurface>
</ItemsControl.ItemTemplate>
</ItemsControl>
<!– Requires binding to SciChartSurface, but we can’t get this if its inside an ItemTemplate! –>
<sciChart:SciChartOverview Grid.Row="1" ParentSurface="{Binding ElementName=sciChart}"
DataSeries="{Binding ElementName=sciChart, Path=RenderableSeries[1].DataSeries}"
SelectedRange="{Binding ElementName=sciChart, Path=XAxis.VisibleRange, Mode=TwoWay}"/>
[/xml]
This isn’t going to work. We must have a reference to first the SciChartSurface created by the ItemsControl. This is what our documented workaround on Adding a SciChartOverview to an ItemsControl does – it digs into the Visual Tree to find the first item generated by the ItemsControl. That’s fine for ItemsControls, but it also won’t work for SciChartGroup.
The solution is to use SciChart’s new ScrollBar API, part of v3.2 or later.
What we’re going to do is include a ScrollBar inside the ItemTemplate for every chart pane, but only show it (Visibility.Visible) for the last chart pane. This gives us full control over the positioning of a scrollbar and ability to customise its background.
Note: this solution will now work with both SciChartGroup (multi-paned stock charts), or, ItemsControls in WPF or Silverlight, in v3.2 of SciChart or later.
[xml]
<!– Databinds a SciChartGroup to a list of ChartPaneViewModels –>
<!– Child chart panes are generated using the ItemTemplate below –>
<s:SciChartGroup Grid.Row="1"
ItemsSource="{Binding ChartPaneViewModels}"
s:ThemeManager.Theme="{Binding ElementName=ThemeCombo, Path=SelectedItem}"
ItemContainerStyle="{StaticResource ChartPaneStyle}">
<s:SciChartGroup.ItemTemplate>
<DataTemplate>
<!– DataTemplate instantiates this View per ChartPaneViewModel –>
<!– This includes a SciStockChart, which is a specialized form of SciChartSurface –>
<!– which is tailored for Stock Charts (financial charts) with CategoryDateTimeAxis –>
<!– –>
<!– It also includes a SciChartScrollbar to create a custom overview control, which is Collapsed for all but the last pane –>
<Grid>
<Grid.RowDefinitions>
<RowDefinition Height="*"/>
<RowDefinition Height="Auto"/>
</Grid.RowDefinitions>
<!– Databinds each child SciStockChart to … –>
<!– SeriesSource to BaseChartPaneViewModel.ChartSeriesViewModels –>
<!– Axis Properties, like s:StockChartXAxis.VisibleRange to CreateMultiPaneStockChartsViewModel.XVisibleRange –>
<!– Axis Properties, like s:StockChartYAxis.GrowBy to BaseChartPaneViewModel.IsFirstChartPane with a converter to change behaviour based on pane position–>
<s:SciStockChart x:Name="PART_ChartPaneView"
SeriesSource="{Binding ChartSeriesViewModels}">
<!– Properties omitted for brevity –>
</s:SciStockChart>
<!– Displays a SciChartScrollBar bound to the charts XAxis, and visible only for last chart pane –>
<Grid Grid.Row="1" Visibility="{Binding IsLastChartPane, Converter={StaticResource BoolToVisibilityConverter}}">
<!– This is the Chart behind the scrollbar, bound to the First ChartPaneViewModel, first DataSeries –>
<!– It displays the data as a FastMountainRenderableSeries –>
<s:SciStockChart x:Name="PART_ScrollbarChartBackground"
Style="{StaticResource OverviewChartStyle}">
<s:SciStockChart.RenderableSeries>
<s:FastMountainRenderableSeries DataSeries="{Binding ParentViewModel.ChartPaneViewModels[0].ChartSeriesViewModels[0].DataSeries}"/>
</s:SciStockChart.RenderableSeries>
</s:SciStockChart>
<!– This is the scrollbar, its bound to the PART_ChartPaneView.XAxis above –>
<s:SciChartScrollbar
Margin="{Binding ElementName=PART_ChartPaneView, Path=Padding, Mode=OneWay}"
Axis="{Binding ElementName=PART_ChartPaneView, Path=XAxis }"
Style="{StaticResource ScrollBarStyle}"/>
</Grid>
</Grid>
</DataTemplate>
</s:SciChartGroup.ItemTemplate>
</s:SciChartGroup>
[/xml]
Pretty awesome! We will be including this sample with the v3.2 Create Multi-Paned Stock Charts example, which is due to be released very shortly!
Related Posts
![]()
Queens Award for Innovation
Proud winners of the Queens Award for Innovation, 2019. Awarded on account of our innovative graphics engine which underpins the SciChart library and enables our world-beating charting performance
![]()
National Business Awards
Highly Commended for Lloyds National Business Awards, 2019. Awarded on account of our innovative graphics engine and impressive customer base
![]()
National Technology Awards
Awarded “Healthcare Tech of the Year” at the 2025 National Technology Awards – a top UK recognition for breakthrough innovation in technology.

Reviews
SciChart has received hundreds of verified, 3rd party reviews