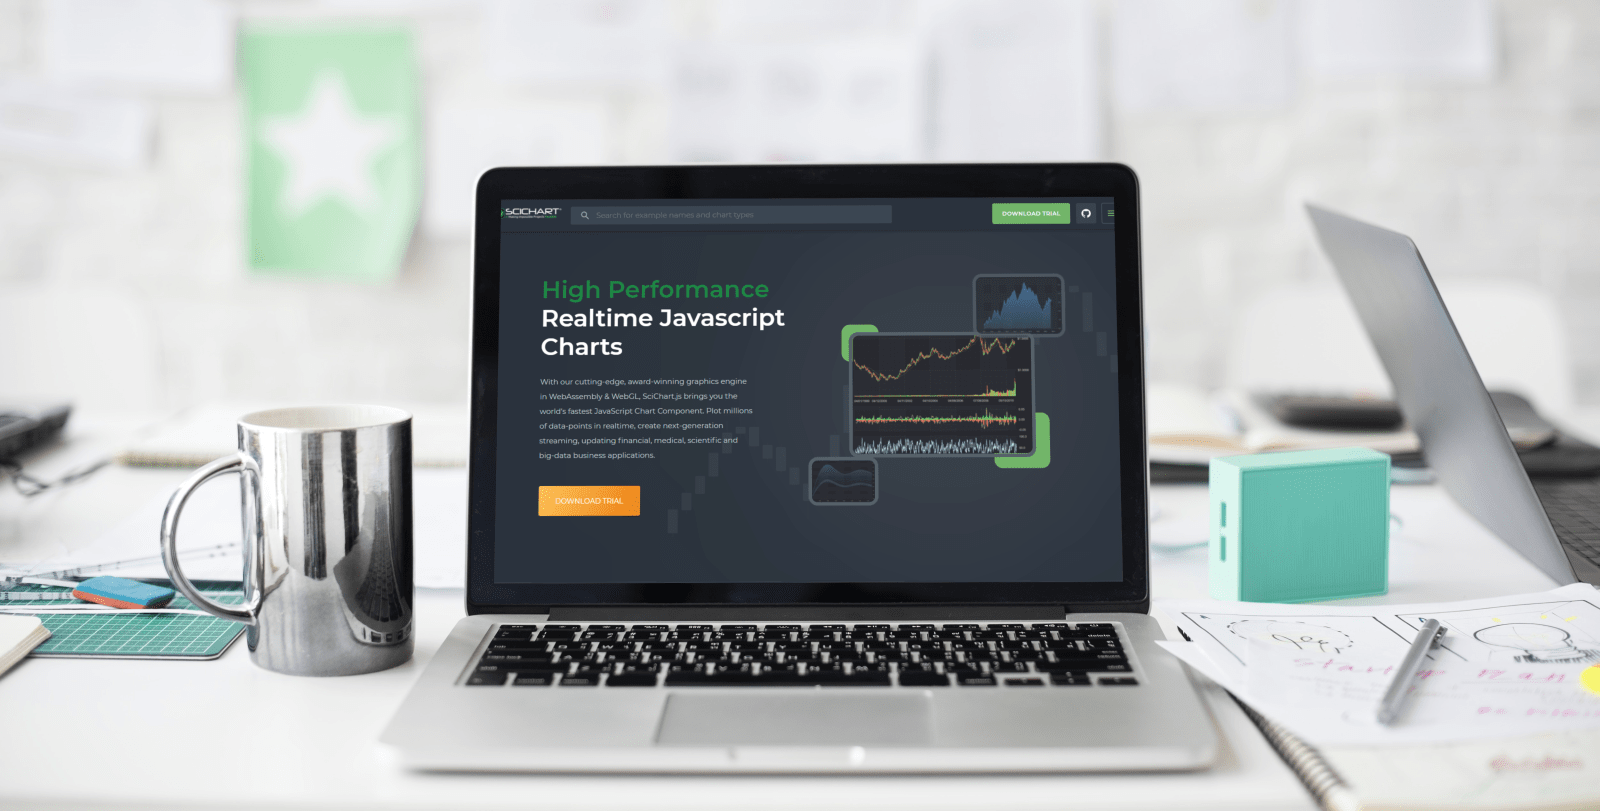
We are excited to announce SciChart JavaScript ultra-high-performance charts version is 1.4.1595 released!
It consists of many memory leaks that are fixed, other important bug fixes, and great improvements. It is suggested for all the users of SciChart.js v 1.3 and earlier to upgrade to this version.
What’s new in SciChart.js v1.4.1595?
Important Fixes
- Fixed memory leaks for Heatmap, Contour Chart, LineAnnotation, CursorModifier and RolloverModifier
- Fixed Gradient Brush memory leak
- Fixed PointMarkers for Y2 values for Band Spline Animation
- Fixed initial blinking when animating series with point markers
- Fixed Grid axis bands draw incorrectly with flippedCoordinates = true (SCJS-554)
- Fixed FadeAnimation overrides PointMarker.Opacity property (SCJS-563)
- Fixed Hit-Test Algorithm returns wrong results depending on data (SCJS-562)
- Fixed Hit-Test algorithm returns IsHit=false when clicking to the left of first data-point (SCJS-566)
- Fixed Uncaught TypeError: tooltipTitle.replace is not a function ( SCJS-570)
- Fixed using multiplying alpha cahnnel approach for applying opacity instead of overriding
- Fixed and removed console messages when suspendUpdates is used
- Fixed Heatmap does not respect colorMap.maximum property
- Fixed Error on remove RenderableSeries with RolloverModifier (SCJS-592)
- Fixed Real-time ticking chart buttons in JavaScript Real-time Stock Chart Example
- Fixed: updating legend on series remove, JavaScript Chart Legends API
- Fixed issue with mousewheel interaction in Firefox (SCJS-513)
- Fixed Legend for stacked series
- Fixed black screen bug using SciChartSurface.createSingle API
- Fixed: modifiers synchronisation when using multiple surfaces with SciSurface.createSingle API
- Fixed RolloverModifier issues
New examples and Improvements
- Added movable AxisMarkerAnnotation
- Added tooltipLegendTemplate to RolloverModifier
- Added JavaScript Drag Horizontal Threshold Example
- Added easing function to animations API (SCJS-560)
- Added opacity property to all Annotations (SCJS-565)
- Unified opacity updating logic
- Added PinchZoomModifier to 2D Charts and improved handling of multitouch in ZoomPanModifier (SCJS-375)
- Added SmartDateLabelProvider to JavaScript Stock Charts Example
- Added an option to include/exclude series to RolloverModifier and CursorModifier examples
- Added a separate collection for annotations being used in modifiers (SCJS-521)
- Added ResizeDirections property to AnnotationBase class (SCJS-526)
- Added ResizeDirections proert to RubberBandXyZoomModifier.XyDirection behaviour to limit drag-zoom rect to X or Y direction (SCJS-599)
- Updated SimpleDataPointSelection example
Known issue: WebGL Context loss issue on Intel HD 620/630 hardware. Our team is in communication with Intel engineers to resolve this.
Where to get SciChart.js v1.4.1595
You can get SciChart.js version 1.4.1595 examples zip from our downloads page at www.scichart.com/downloads. You will need to create an account at scichart.com/login in order to access this page.
If you need any help with getting started, including how to start a trial, please check our getting started guide.
We are always open to the feedback and will be happy to hear back!
Best regards,
Julia
[SciChart Team]
Related Posts
