
Tooltips may be added to the SciChartSurface using the TooltipModifier. This is a ChartModifierBase derived type which is attached to the SciChartSurface.ChartModifier property.
NOTE: The Tooltip is specifically suited for scatter X-Y data, although it may be used for any type of data in SciChart where you want a tooltip to appear on mouse-over of a data-point on the chart.
Adding a TooltipModifier to the Chart – Xaml
To add a TooltipModifier to the chart, use the following code:
| Adding a TooltipModifier to the Chart |
Copy Code |
|---|---|
<!-- where xmlns:s="http://schemas.abtsoftware.co.uk/scichart" --> <s:SciChartSurface> <s:SciChartSurface.ChartModifier> <s:ModifierGroup> <s:TooltipModifier IsEnabled="True" /> </s:ModifierGroup> </s:SciChartSurface.ChartModifier> </s:SciChartSurface> | |
Adding a TooltipModifier to the Chart – Code
The equivalent code to add a TooltipModifier in C# is as follows:
| Adding a TooltipModifier to the Chart |
Copy Code |
|---|---|
var sciChartSurface = new SciChartSurface(); sciChartSurface.ChartModifier = new ModifierGroup(new TooltipModifier() { IsEnabled = true, }); | |
Controlling Which Series participate in Tooltips
You can exclude a specific RenderableSeries from the TooltipModifier by setting the attached property TooltipModifier.IncludeSeries to false. By default this is true for all RenderableSeries.
| Controlling Which Series participate in Tooltips |
Copy Code |
|---|---|
<!-- where xmlns:s="http://schemas.abtsoftware.co.uk/scichart" --> <s:SciChartSurface> <s:SciChartSurface.RenderableSeries> <s:FastLineRenderableSeries s:TooltipModifier.IncludeSeries="False"/> </s:SciChartSurface.RenderableSeries> </s:SciChartSurface> | |
| Controlling Which Series participate in Tooltips |
Copy Code |
|---|---|
var sciChartSurface = new SciChartSurface(); var renderSeries = new FastLineRenderableSeries(); sciChartSurface.RenderableSeries.Add(renderSeries); TooltipModifier.SetIncludeSeries(renderSeries, false); | |
Styling the Tooltip Item Template
The tooltip item template can be styled in exactly the same was as the RolloverModifier, via the TooltipModifier.TooltipItemTemplate attached property. This defines a DataTemplate for some UI which binds to an instance of SeriesInfo. For a full description of the SeriesInfo types please see RolloverModifier
| Styling the Tooltip Item Template |
Copy Code |
|---|---|
<s:SciChartSurface > <s:SciChartSurface.Resources> <!-- Tooltip Template for an XyDataSeries binds to XySeriesInfo --> <!-- Check out the properties on XySeriesInfo to see what you can bind to --> <DataTemplate x:Key="XyTooltipTemplate" DataType="s:XySeriesInfo"> <StackPanel Orientation="Vertical"> <TextBlock Foreground="White"> <Run Text="Series: "/> <Run Text="{Binding SeriesName, StringFormat='{}{0}:'}"/> </TextBlock> <TextBlock Foreground="White"> <Run Text="X-Value: "/> <Run Text="{Binding FormattedXValue}"/> </TextBlock> <TextBlock Foreground="White"> <Run Text="Y-Value: "/> <Run Text="{Binding FormattedYValue}"/> </TextBlock> </StackPanel> </DataTemplate> </s:SciChartSurface.Resources> <s:SciChartSurface.RenderableSeries> <s:FastLineRenderableSeries s:TooltipModifier.TooltipTemplate="{StaticResource XyTooltipTemplate}"/> </s:SciChartSurface.RenderableSeries> <s:SciChartSurface.ChartModifier> <s:ModifierGroup> <s:RolloverModifier ShowTooltipOn="Always" /> </s:ModifierGroup> </s:SciChartSurface.ChartModifier> </s:SciChartSurface> | |
Styling the Tooltip Container Style
The tooltip container can be styled in exactly the same way as the RolloverModifier, via the TooltipModifier.TooltipContainerStyle attached property.
| Styling the Tooltip Container Style |
Copy Code |
|---|---|
<s:SciChartSurface> <s:SciChartSurface.Resources> <!-- The TooltipControl template is defined below --> <!-- Change this if you want to have a non-default tooltip container --> <!-- The ContentPresenter is bound to the DataContext (a SeriesInfo type) --> <!-- and the ContentTemplate is the DataTemplate for the SeriesInfo --> <!-- Finally, the TooltipContainerStyle is set on the RenderableSeries --> <Style x:Key="TooltipStyle1" TargetType="s:TooltipControl"> <Setter Property="Template"> <Setter.Value> <ControlTemplate TargetType="s:TooltipControl"> <Border Background="#ff6495ed" BorderBrush="#ff4d81dd" BorderThickness="2" Effect="{StaticResource DropShadowEffect}" Opacity="0.9" Padding="5"> <ContentPresenter Content="{TemplateBinding DataContext}" ContentTemplate="{TemplateBinding ContentTemplate}" /> </Border> </ControlTemplate> </Setter.Value> </Setter> </Style> </s:SciChartSurface.Resources> <s:SciChartSurface.RenderableSeries> <s:FastLineRenderableSeries s:TooltipModifier.TooltipContainerStyle="{StaticResource TooltipStyle1}"/> </s:SciChartSurface.RenderableSeries> </s:SciChartSurface> | |
Changing the Tooltip DataContext
The TooltipModifier features the ability to easily change the DataContext (or viewmodel) for Tooltips, via the TooltipModifier.TooltipLabelDataContextSelector property.
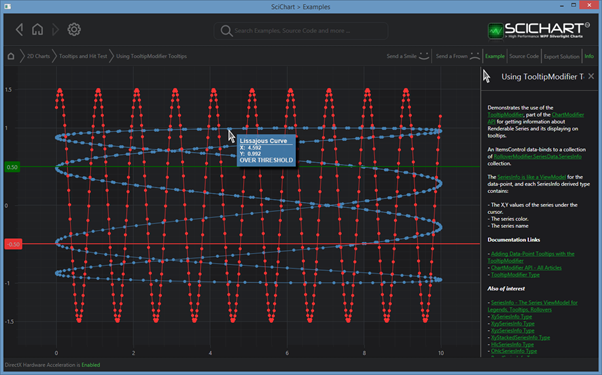
In the Examples > 2D Charts > Tooltips and Hit Test > Using TooltipModifier Tooltips example the TooltipModifier.TooltipLabelDataContextSelector property is bound to a ViewModel property allowing you to wrap extra info around the SeriesInfo provided by SciChart. This lets you inject extra information into the tooltips easily.