
Templating the Axis Panel – Vertically Stacked Axis
Yet more customisation is possible in SciChart, it is possible to template the axis panel on the top, right, buttom and left of the SciChartSurface to allow many overlapping traces on a single chart.
Default AxisPanelTemplate
By default, the axis panel has the following template:
| Default AxisPanelTemplate |
Copy Code |
|---|---|
<!-- The default Axis Panel Template for Left/Right YAxis --> <ItemsPanelTemplate x:Key="DefaultYAxesPanel"> <StackPanel Orientation="Horizontal" /> </ItemsPanelTemplate> <!-- The default Axis Panel Template for Top/Bottom XAxis --> <ItemsPanelTemplate x:Key="DefaultXAxesPanel"> <StackPanel Orientation="Vertical" /> </ItemsPanelTemplate> | |
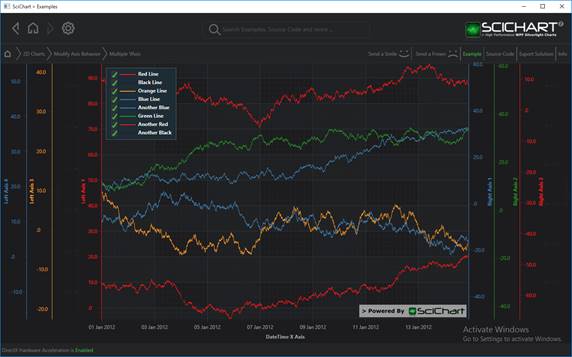
By default a chart with multiple Y-Axis will stack them horizontally.
This causes YAxes to be displayed from left to right, and XAxis to be displayed from top to bottom.
Custom (Vertically Stacked) AxisPanelTemplate
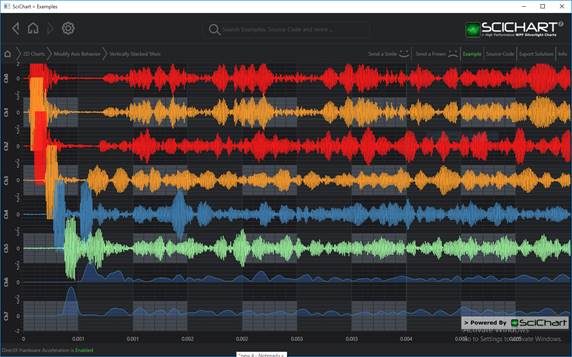
In the SciChart WPF Examples -> Vertically Stacked Axis example, we demonstrate how to change the SciChartSurface.LeftAxesPanelTemplate to allow stacking axis vertically, to create an ECG style trace. Many series are on the chart, each with their own YAxis area, but they are allowed to overlap.
However it is also possible to stack axis vertically, by changing the AxesPanelTemplate
The template to achieve this is as follows:
| Custom (Vertically Stacked) AxisPanelTemplate |
Copy Code |
|---|---|
<Grid> <Grid.Resources> <!-- Optionally replace the default StackPanel for the Axis Container. <!-- In this example we create a Grid --> <!-- with 4x rows and one column. Then use Grid.Row on the actual Axis instances --> <!-- to place in the correct rows --> <!-- --> <!-- By Default SciChart will place YAxes stacked horizontally, but using --> <!-- this feature we can override to place vertically on the same chart surface --> <ItemsPanelTemplate x:Key="YAxesPanel"> <Grid> <Grid.RowDefinitions> <RowDefinition Height="*"/> <RowDefinition Height="10"/> <RowDefinition Height="*"/> <RowDefinition Height="10"/> <RowDefinition Height="*"/> <RowDefinition Height="10"/> <RowDefinition Height="*"/> <RowDefinition Height="10"/> <RowDefinition Height="*"/> <RowDefinition Height="10"/> <RowDefinition Height="*"/> <RowDefinition Height="10"/> <RowDefinition Height="*"/> <RowDefinition Height="10"/> <RowDefinition Height="*"/> </Grid.RowDefinitions> <Grid.ColumnDefinitions> <ColumnDefinition Width="Auto"/> </Grid.ColumnDefinitions> </Grid> </ItemsPanelTemplate> </Grid.Resources> <!-- Create the chart surface --> <!-- where xmlns:s="http://schemas.abtsoftware.co.uk/scichart" --> <s:SciChartSurface x:Name="sciChart" LeftAxesPanelTemplate="{StaticResource YAxesPanel}" RightAxesPanelTemplate="{StaticResource YAxesPanel}"> <!-- Declare RenderableSeries (Omitted for brevity) --> <!-- Create an X Axis --> <s:SciChartSurface.XAxis> <s:NumericAxis/> </s:SciChartSurface.XAxis> <!-- Create a Y Axis with Grid.Row to position on the YAxis Panel --> <s:SciChartSurface.YAxes> <s:NumericAxis x:Name="Ch0" Id="Ch0" AxisTitle="Ch0" Grid.Row="0"/> <s:NumericAxis x:Name="Ch1" Id="Ch1" AxisTitle="Ch1" Grid.Row="2" /> <s:NumericAxis x:Name="Ch2" Id="Ch2" AxisTitle="Ch2" Grid.Row="4" /> <s:NumericAxis x:Name="Ch3" Id="Ch3" AxisTitle="Ch3" Grid.Row="6" /> <s:NumericAxis x:Name="Ch4" Id="Ch4" AxisTitle="Ch4" Grid.Row="8" /> <s:NumericAxis x:Name="Ch5" Id="Ch5" AxisTitle="Ch5" Grid.Row="10" /> <s:NumericAxis x:Name="Ch6" Id="Ch6" AxisTitle="Ch6" Grid.Row="12" /> <s:NumericAxis x:Name="Ch7" Id="Ch7" AxisTitle="Ch7" Grid.Row="14" /> </s:SciChartSurface.YAxes> </s:SciChartSurface> </Grid> | |
NOTE: If you want to have many traces but not overlapping, you can achieve this by simply Synchronizing Multiple SciChartSurfaces.
The AxesPanelTemplate feature is an advanced feature which is specifically used when you want an ECG style trace, with many independent traces overlapping on the same chart.