Building a Smith Chart in JavaScript: Inside the Rendering Pipeline
See how SciChart.js was extended to build a fully interactive Smith chart using standard APIs. This article highlights the flexibility of custom rendering and advanced interactions.

At SciChart, we serve customers in many industries and sectors. One sector that keeps coming back to use our chart software again and again is the oil and gas industry. In this blog post, we deep dive into how SciChart can help solve data visualization problems in the oil and gas industry, and what chart types and features make us a great fit for explorers or producers who need to visualize complex or big data.
First up, what is SciChart, and more importantly, what isn’t it?
SciChart is a software library for adding charts and graphs to applications. Our chart library supports JavaScript, TypeScript in browser or electron apps, C# WPF on Windows, Swift on macOS and iOS and Kotlin on Android.
Our customers are software development teams that are building apps that need to visualize data in 2D or 3D WPF charts and graphs. We don’t sell an off-the-shelf SaaS app for oil and gas prospecting. Instead, we sell chart libraries that help you build the best prospecting or exploration tools for internal or external teams. If that’s you, and you’d like to find out how, read on.
We asked our customers to name the most important chart types or features for oil and gas data visualization. This is what they told us:
SciChart can handle all these scenarios and more.
Let’s dig into the features and showcase some demos below:
We’ve created some oil and gas dashboard demos showing you how to configure SciChart for oil and gas applications below. These have been created in both JavaScript for browser apps and WPF / C# for Windows desktop apps.
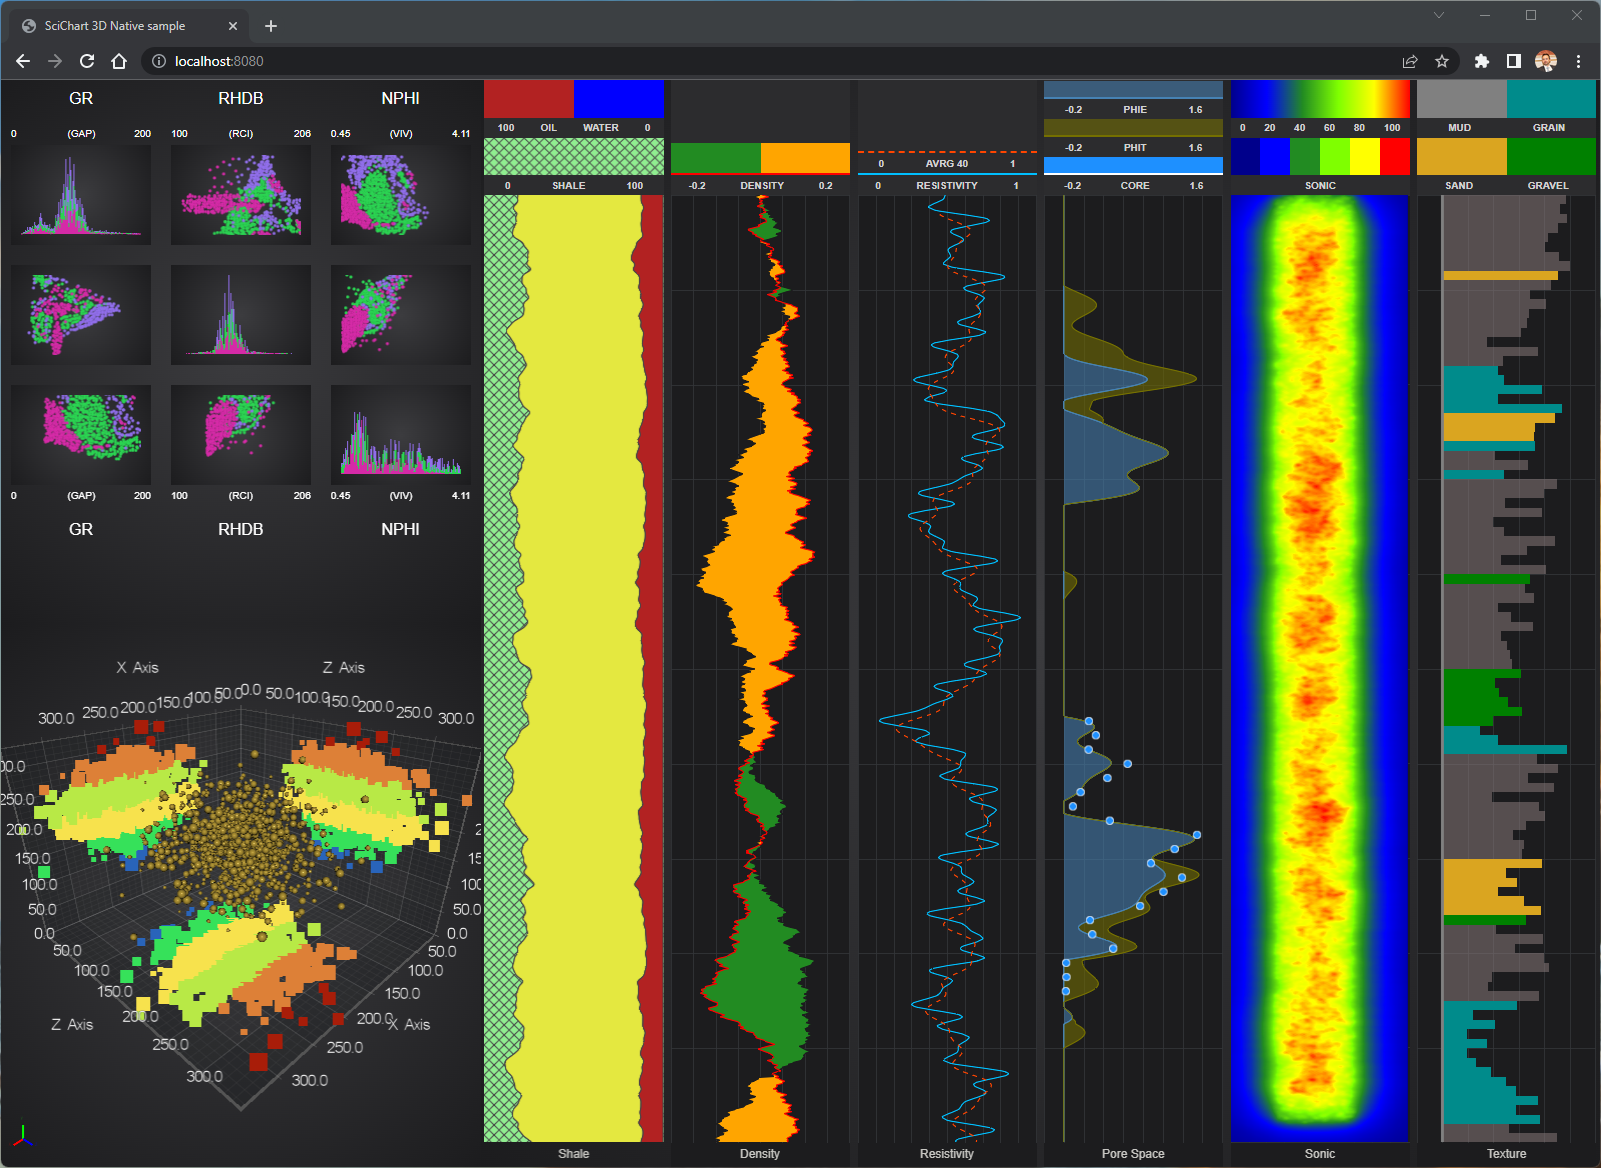
Above is our oil and gas dashboard demo, which we’ve created in JavaScript as well as WPF (Windows).
We’re using the vertical chart features in SciChart to arrange numerous drill depth charts. These have synchronized zooming, panning, and tooltips using a feature we call the RolloverModifier. Each vertical chart has a different visualization to showcase the flexibility and power of SciChart.
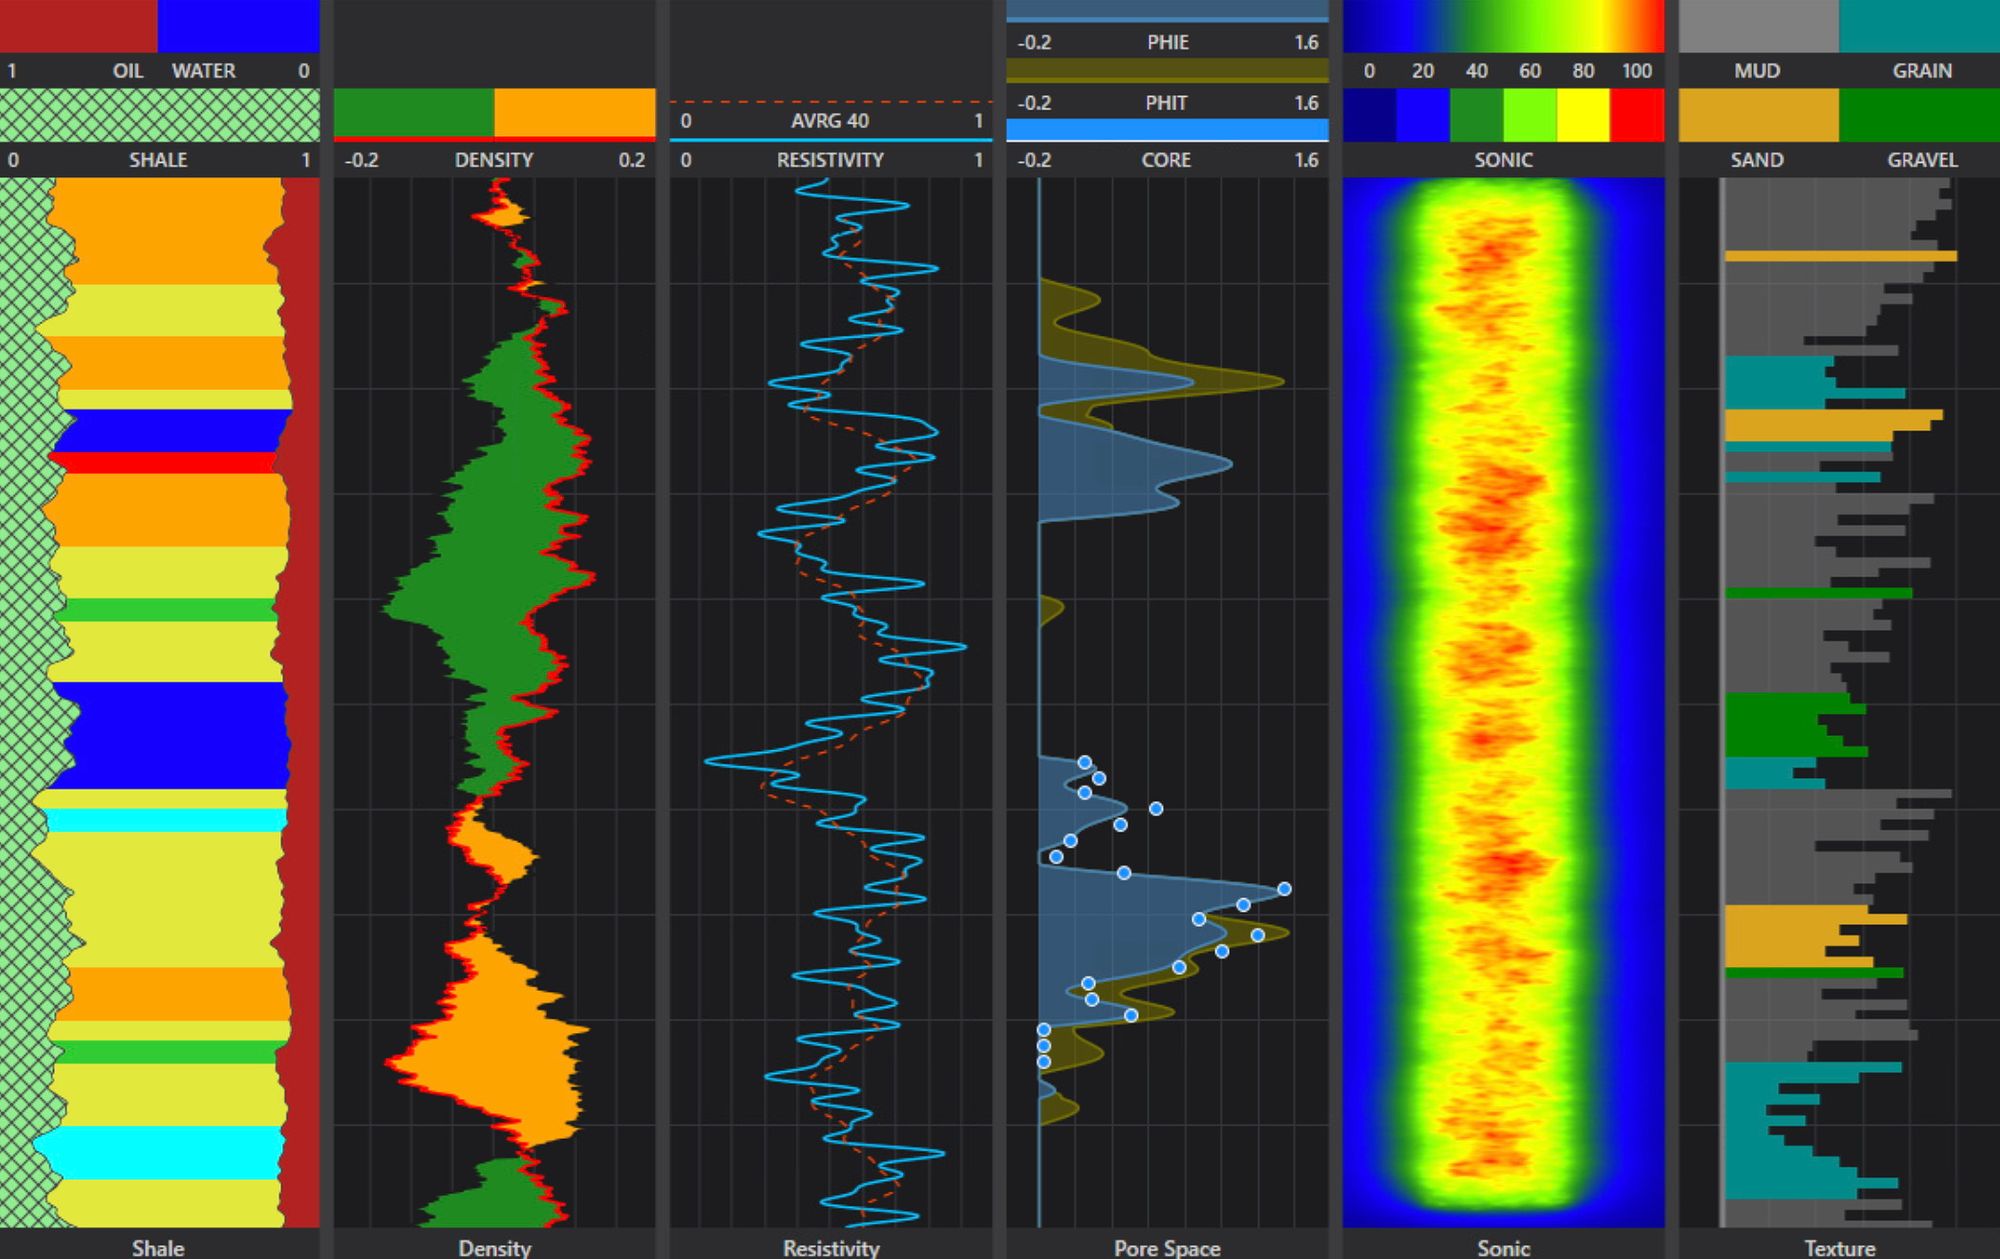
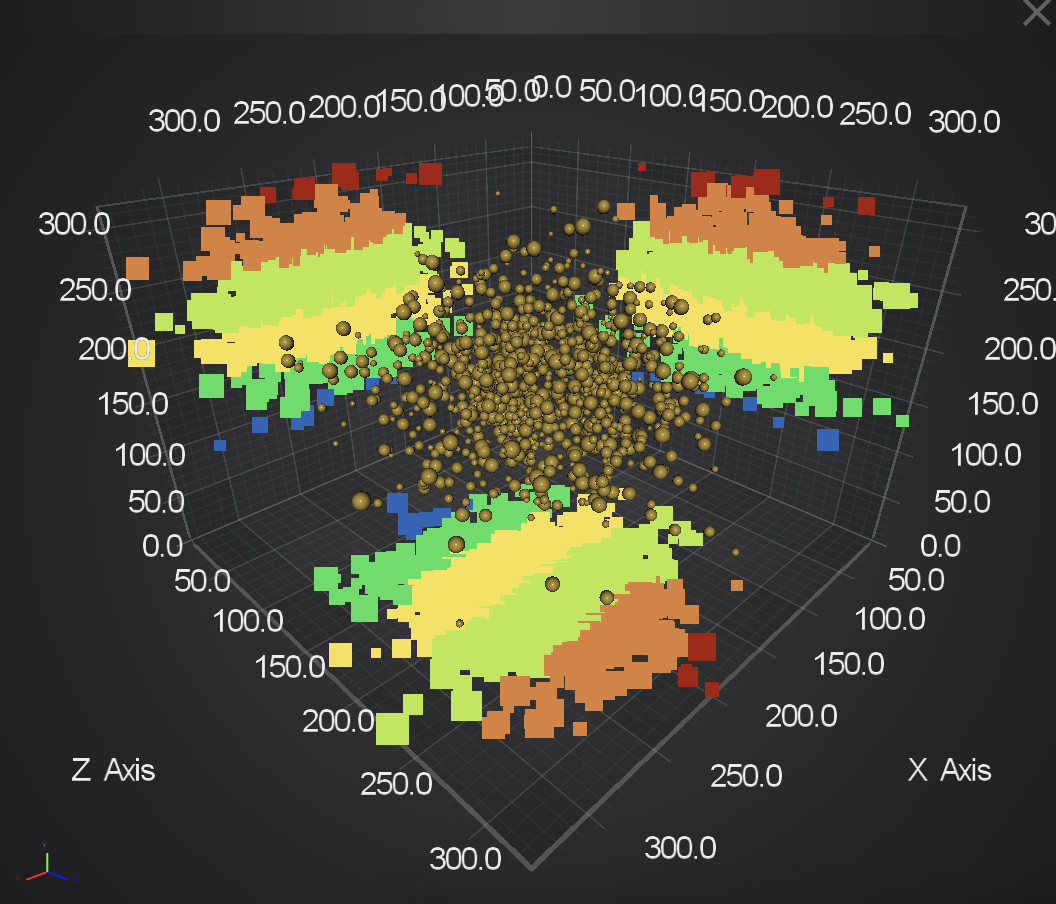
3D charts and heatmaps (sonogram/spectrogram) are supported. Our JavaScript heatmaps are high-performing and update in realtime to show ultrasound or spectrogram data from oilwell sensors.
To find out more about SciChart or enquire about how we can help with your data visualization for the oil and gas industry, including prospecting, exploration or management applications, get in touch using the contact form.
Start using SciChart.js Today
SciChart.js is now available with a FREE community edition (no trial, sign-up or credit card required) where you can try out the library commercially or use it in a non-commercial application. You can also get a free trial of our WPF chart library. If you have a question or would like to give feedback, contact us.
Recent Blogs
![]()
Queens Award for Innovation
Proud winners of the Queens Award for Innovation, 2019. Awarded on account of our innovative graphics engine which underpins the SciChart library and enables our world-beating charting performance
![]()
National Business Awards
Highly Commended for Lloyds National Business Awards, 2019. Awarded on account of our innovative graphics engine and impressive customer base
![]()
National Technology Awards
Awarded “Healthcare Tech of the Year” at the 2025 National Technology Awards – a top UK recognition for breakthrough innovation in technology.

Reviews
SciChart has received hundreds of verified, 3rd party reviews