Xamarin Chart - Examples
Please note! These examples are new to SciChart Mobile v3 release! SciChart iOS & Android ship with Xamarin.iOS and Xamarin.Android bindings around our native iOS & Android Chart controls, allowing you to create fast & feature rich charts to your Xamarin applications. We include ~90 native iOS examples and 90 Android examples, but now also ~60 Xamarin Chart Examples to help you get started with SciChart. You can download the source for our Xamarin Chart Examples from Github, or browse the source code below.
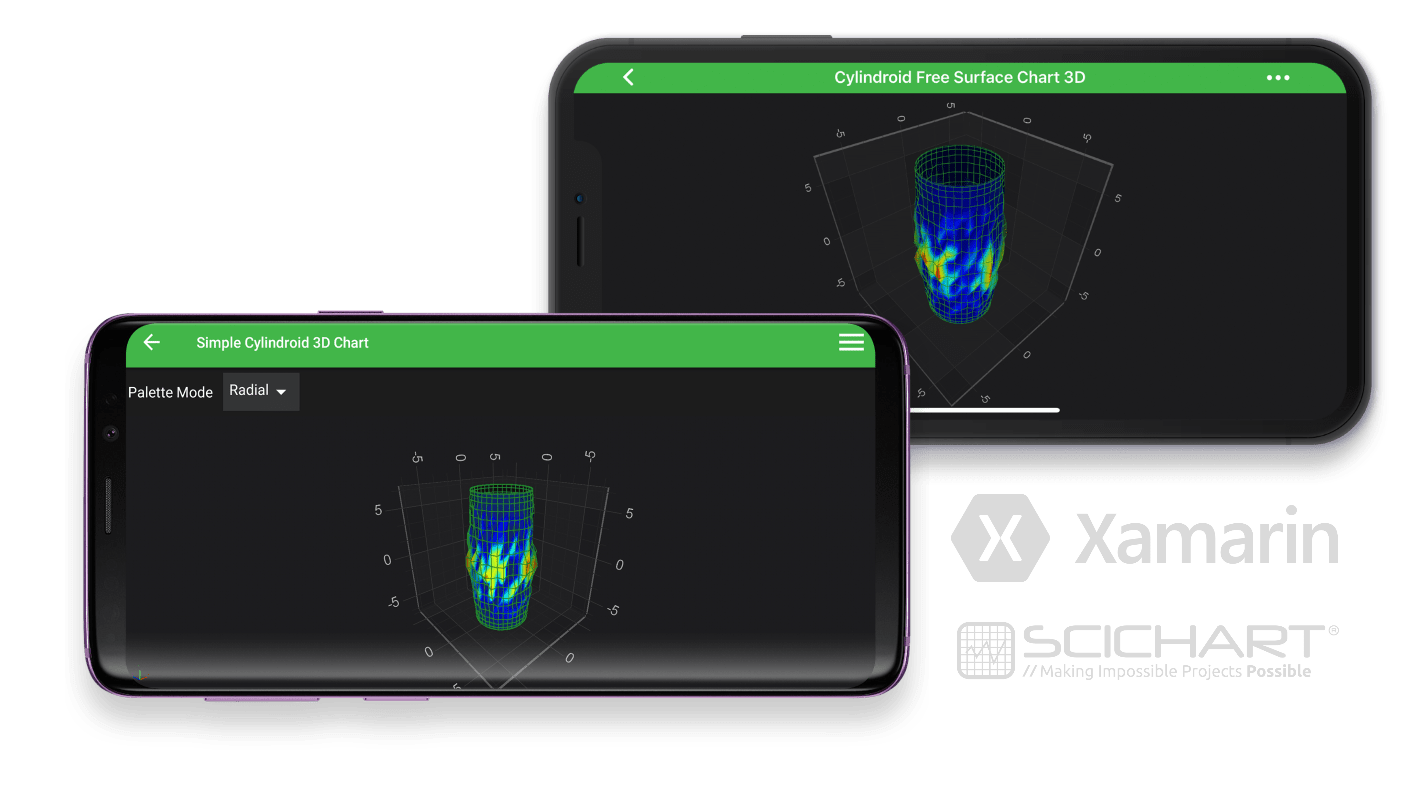
This example demonstrates how to create 3D Cylindroid graph in Xamarin.
Learn more in our articles and documentation Cylindroid 3D Chart:
Create a 3D Chart in Xamarin.Android
Create a 3D Chart in Xamarin.iOS

The C#/Xamarin.iOS/Xamarin.Android source code for the Xamarin Simple Cylindroid 3D Chart example is included below (Scroll down!).
Did you know you can also view the source code from one of the following sources as well?
- Clone the SciChart.Xamarin.Examples from Github.
- Also, the SciChart for Xamarin Trial contains the full source code for the Xamarin chart examples (link below).
CylindroidMesh3DChartViewController.cs (Xamarin.iOS)
View source codeusing System;
using SciChart.iOS.Charting;
using Xamarin.Examples.Demo.Utils;
namespace Xamarin.Examples.Demo.iOS
{
[Example3DDefinition("Cylindroid 3D Chart", description: "Create a simple Cylindroid 3D Chart", icon: ExampleIcon.Surface3D)]
class CylindroidMesh3DChartViewController : SingleChartViewController<SCIChartSurface3D>
{
protected override void InitExample()
{
const int uSize = 40, vSize = 20;
var dataSeries3D = new CylindroidDataSeries3D<double, double>(uSize, vSize) { A = 3, B = 3, H = 7 };
var random = new Random();
for (int u = 0; u < uSize; u++)
{
for (int v = 0; v < vSize; v++)
{
var weight = 1d - Math.Abs(2d * v / vSize - 1d);
var offset = random.NextDouble();
dataSeries3D.SetDisplacement(u, v, offset * weight);
}
}
var rSeries3D = new SCIFreeSurfaceRenderableSeries3D
{
DataSeries = dataSeries3D,
DrawMeshAs = SCIDrawMeshAs.SolidWireframe,
Stroke = 0x77228B22,
ContourInterval = 0.1f,
ContourStroke = 0x77228B22,
StrokeThickness = 1f,
MeshColorPalette = new SCIGradientColorPalette(
new[] { ColorUtil.Sapphire, ColorUtil.Blue, ColorUtil.Cyan, ColorUtil.GreenYellow, ColorUtil.Yellow, ColorUtil.Red, ColorUtil.DarkRed },
new[] { 0, .1f, .3f, .5f, .7f, .9f, 1 }),
PaletteMinimum = new SCIVector3(3, 0, 0),
PaletteMaximum = new SCIVector3(4, 0, 0),
};
using (Surface.SuspendUpdates())
{
Surface.XAxis = new SCINumericAxis3D { VisibleRange = new SCIDoubleRange(-7, 7) };
Surface.YAxis = new SCINumericAxis3D { VisibleRange = new SCIDoubleRange(-7, 7) };
Surface.ZAxis = new SCINumericAxis3D { VisibleRange = new SCIDoubleRange(-7, 7) };
Surface.RenderableSeries.Add(rSeries3D);
Surface.ChartModifiers.Add(CreateDefault3DModifiers());
Surface.WorldDimensions = new SCIVector3(200, 200, 200);
}
}
}
}CreateCylindroidMesh3DChartFragment.cs (Xamarin.Android)
View source codeusing System;
using System.Drawing;
using SciChart.Charting3D.Common.Math;
using SciChart.Charting3D.Model;
using SciChart.Charting3D.Model.DataSeries.FreeSurface;
using SciChart.Charting3D.Modifiers;
using SciChart.Charting3D.Visuals;
using SciChart.Charting3D.Visuals.Axes;
using SciChart.Charting3D.Visuals.Camera;
using SciChart.Charting3D.Visuals.RenderableSeries.Data;
using SciChart.Charting3D.Visuals.RenderableSeries.FreeSurface;
using SciChart.Core.Utility;
using SciChart.Data.Model;
using Xamarin.Examples.Demo;
using Xamarin.Examples.Demo.Droid.Extensions;
using Xamarin.Examples.Demo.Droid.Fragments.Base;
namespace Xamarin.Examples.Demo.Droid.Fragments.Examples3D
{
[Example3DDefinition("Simple Cylindroid 3D Chart", description: "Create a simple Cylindroid 3D Chart", icon: ExampleIcon.Surface3D)]
class CreateCylindroidMesh3DChartFragment : ExampleBaseFragment
{
public SciChartSurface3D Surface => View.FindViewById<SciChartSurface3D>(Resource.Id.chart3d);
public override int ExampleLayoutId => Resource.Layout.Example_Single_3D_Chart_Fragment;
protected override void InitExample()
{
const int uSize = 40, vSize = 20;
var dataSeries3D = new CylindroidDataSeries3D<double, double>(uSize, vSize)
{
A = 3d,
B = 3d,
H = 7d
};
var random = new Random();
for (int u = 0; u < uSize; u++)
{
for (int v = 0; v < vSize; v++)
{
var weight = 1d - Math.Abs(2d * v / vSize - 1d);
var offset = random.NextDouble();
dataSeries3D.SetDisplacement(u, v, offset * weight);
}
}
var renderableSeries3D = new FreeSurfaceRenderableSeries3D()
{
DataSeries = dataSeries3D,
DrawMeshAs = DrawMeshAs.SolidWireframe,
StrokeColor = Color.FromArgb(0x77, 0x22, 0x8B, 0x22),
ContourInterval = 0.1f,
ContourStrokeColor = Color.FromArgb(0x77, 0x22, 0x8B, 0x22),
StrokeThickness = 1f.ToDip(Activity),
MeshColorPalette = new GradientColorPalette(
new Color[] { Color.FromArgb(0xFF, 0x1D, 0x2C, 0x6B), Color.Blue, Color.Cyan, Color.GreenYellow, Color.Yellow, Color.Red, Color.DarkRed },
new float[] { 0, .1f, .3f, .5f, .7f, .9f, 1 }),
PaletteMinMaxMode = FreeSurfacePaletteMinMaxMode.Relative,
PaletteMinimum = new Vector3(3, 0, 0),
PaletteMaximum = new Vector3(4, 0, 0),
PaletteRadialFactor = 1f,
PaletteAxialFactor = new Vector3(0, 0, 0),
PaletteAzimuthalFactor = 0f,
PalettePolarFactor = 0f
};
using (Surface.SuspendUpdates())
{
Surface.WorldDimensions.Assign(200, 200, 200);
Surface.XAxis = new NumericAxis3D() { VisibleRange = new DoubleRange(-7, 7) };
Surface.YAxis = new NumericAxis3D() { VisibleRange = new DoubleRange(-7, 7) };
Surface.ZAxis = new NumericAxis3D() { VisibleRange = new DoubleRange(-7, 7) };
Surface.Camera = new Camera3D();
Surface.RenderableSeries.Add(renderableSeries3D);
Surface.ChartModifiers = new ChartModifier3DCollection
{
new PinchZoomModifier3D(),
new OrbitModifier3D(),
new ZoomExtentsModifier3D()
};
}
}
}
}