Xamarin Chart - Examples
Please note! These examples are new to SciChart Mobile v3 release! SciChart iOS & Android ship with Xamarin.iOS and Xamarin.Android bindings around our native iOS & Android Chart controls, allowing you to create fast & feature rich charts to your Xamarin applications. We include ~90 native iOS examples and 90 Android examples, but now also ~60 Xamarin Chart Examples to help you get started with SciChart. You can download the source for our Xamarin Chart Examples from Github, or browse the source code below.
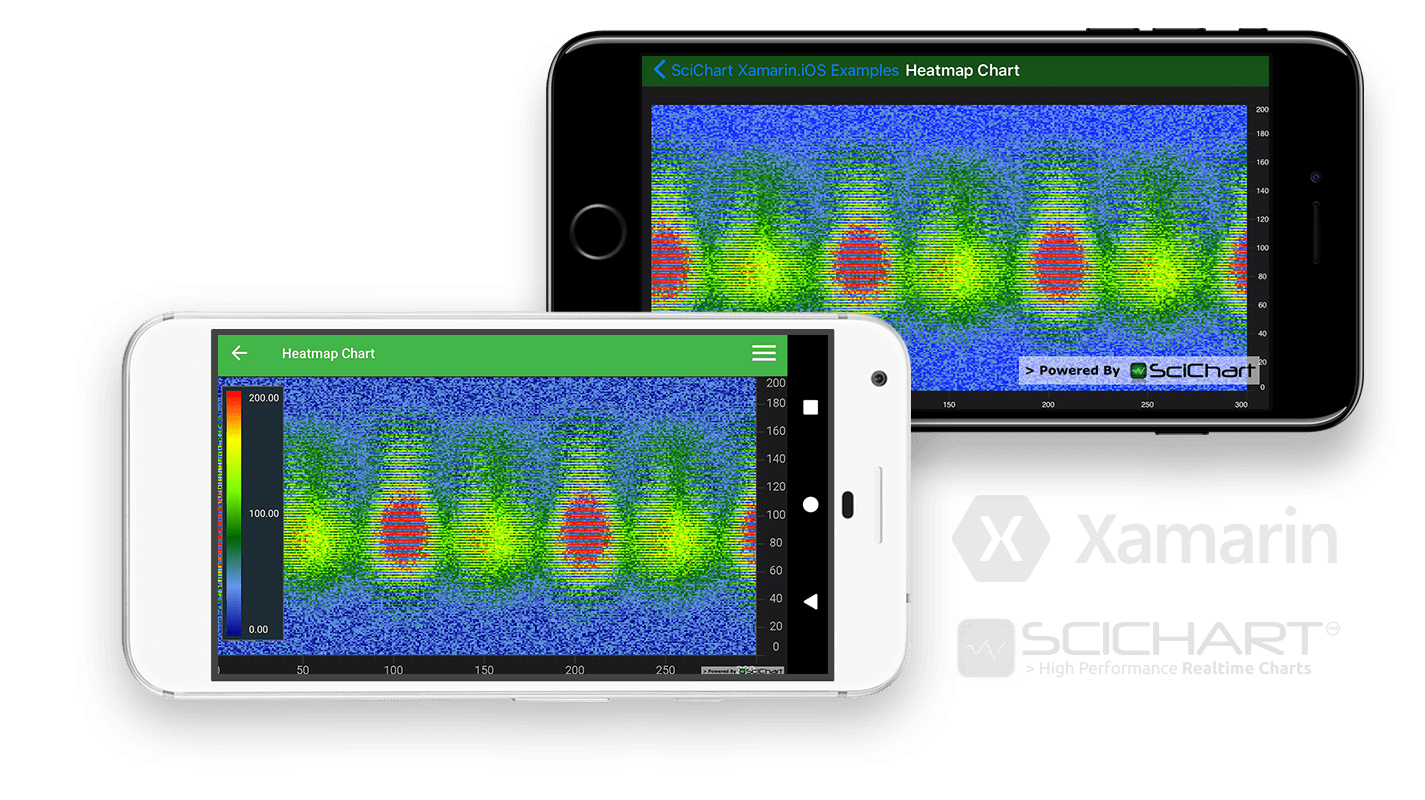
This example showcases how to create a Realtime Heatmap with Xamarin.
Heatmap Charts can be used to visualize a variety of scientific and statistical data on your Android and iOS devices. Display a real-time spectrogram (Fourier Transform plus Time) of audio data. To overlay areas of heat on a background image such as a map or image, or to quickly bring to life 2-dimensional data and show the relative intensities via the heat color.
See Documentation on how to use this type in Android here: The Android Heatmap Chart Documentation. In iOS the equivalent documentation is here: The iOS Heatmap Chart Documentation.
Tip!
In this example you can tap and drag on the chart to see the animated-zoom performance while the Heatmap is updating.

The C#/Xamarin.iOS/Xamarin.Android source code for the Xamarin Heatmap Chart example is included below (Scroll down!).
Did you know you can also view the source code from one of the following sources as well?
- Clone the SciChart.Xamarin.Examples from Github.
- Also, the SciChart for Xamarin Trial contains the full source code for the Xamarin chart examples (link below).
HeatmapChartViewController.cs (Xamarin.iOS)
View source codeHeatmapChartFragment.cs (Xamarin.Android)
View source codeusing System.Collections.Generic;
using System.Threading.Tasks;
using System.Timers;
using System.Drawing;
using SciChart.Charting.Model.DataSeries;
using SciChart.Charting.Visuals;
using SciChart.Charting.Visuals.Axes;
using SciChart.Charting.Visuals.RenderableSeries;
using SciChart.Core.Model;
using Xamarin.Examples.Demo.Data;
using Xamarin.Examples.Demo;
using Xamarin.Examples.Demo.Droid.Fragments.Base;
namespace Xamarin.Examples.Demo.Droid.Fragments.Examples
{
[ExampleDefinition("Heatmap Chart", description:"Demonstrates a Real-time scientific Heatmap", icon: ExampleIcon.HeatmapChart)]
public class HeatmapChartFragment : ExampleBaseFragment
{
public override int ExampleLayoutId => Resource.Layout.Example_Single_Chart_Fragment;
private SciChartSurface Surface => View.FindViewById<SciChartSurface>(Resource.Id.chart);
private const int Width = 300;
private const int Height = 200;
private const int SeriesPerPeriod = 30;
private volatile bool _isRunning = false;
private readonly object _syncRoot = new object();
private readonly Timer _timer = new Timer(40) {AutoReset = true};
private int _timerIndex = 0;
private readonly UniformHeatmapDataSeries<int, int, double> _dataSeries = new UniformHeatmapDataSeries<int, int, double>(Width, Height);
private static readonly List<IValues<double>> ValuesList = new List<IValues<double>>(SeriesPerPeriod);
static HeatmapChartFragment()
{
Task.Run(() =>
{
var array = new double[Width*Height];
for (var i = 0; i < SeriesPerPeriod; i++)
{
DataManager.Instance.SetHeatmapValues(array, i, Width, Height, SeriesPerPeriod);
var doubleValues = new DoubleValues(array);
lock (ValuesList)
{
ValuesList.Add(doubleValues);
}
}
});
}
protected override void InitExample()
{
var xAxis = new NumericAxis(Activity);
var yAxis = new NumericAxis(Activity);
var rs = new FastUniformHeatmapRenderableSeries
{
ColorMap = new ColorMap(new []{Color.DarkBlue, Color.CornflowerBlue, Color.DarkGreen, Color.Chartreuse, Color.Yellow, Color.Red}, new[] {0, 0.2f, 0.4f, 0.6f, 0.8f, 1}),
Minimum = 0,
Maximum = 200,
DataSeries = _dataSeries,
};
Surface.XAxes.Add(xAxis);
Surface.YAxes.Add(yAxis);
Surface.RenderableSeries.Add(rs);
Start();
}
private void Start()
{
if (_isRunning) return;
_isRunning = true;
_timer.Elapsed += OnTick;
_timer.Start();
}
private void OnTick(object sender, ElapsedEventArgs e)
{
lock (_syncRoot)
{
if(!_isRunning) return;
UpdateDataSeries(_timerIndex);
_timerIndex++;
}
}
private void UpdateDataSeries(int index)
{
var values = ValuesList[index%ValuesList.Count];
_dataSeries.UpdateZValues(values);
}
public override void OnDestroyView()
{
base.OnDestroyView();
Stop();
}
private void Stop()
{
if(!_isRunning) return;
_isRunning = false;
_timer.Stop();
_timer.Elapsed -= OnTick;
}
public override void InitExampleForUiTest()
{
base.InitExampleForUiTest();
lock (_syncRoot)
{
Stop();
UpdateDataSeries(0);
}
}
}
}