Xamarin Chart - Examples
Please note! These examples are new to SciChart Mobile v3 release! SciChart iOS & Android ship with Xamarin.iOS and Xamarin.Android bindings around our native iOS & Android Chart controls, allowing you to create fast & feature rich charts to your Xamarin applications. We include ~90 native iOS examples and 90 Android examples, but now also ~60 Xamarin Chart Examples to help you get started with SciChart. You can download the source for our Xamarin Chart Examples from Github, or browse the source code below.
SciChart’s Charts are popular with traders as they are a good fit for use in real-time trading systems, in demanding and fast-moving markets.
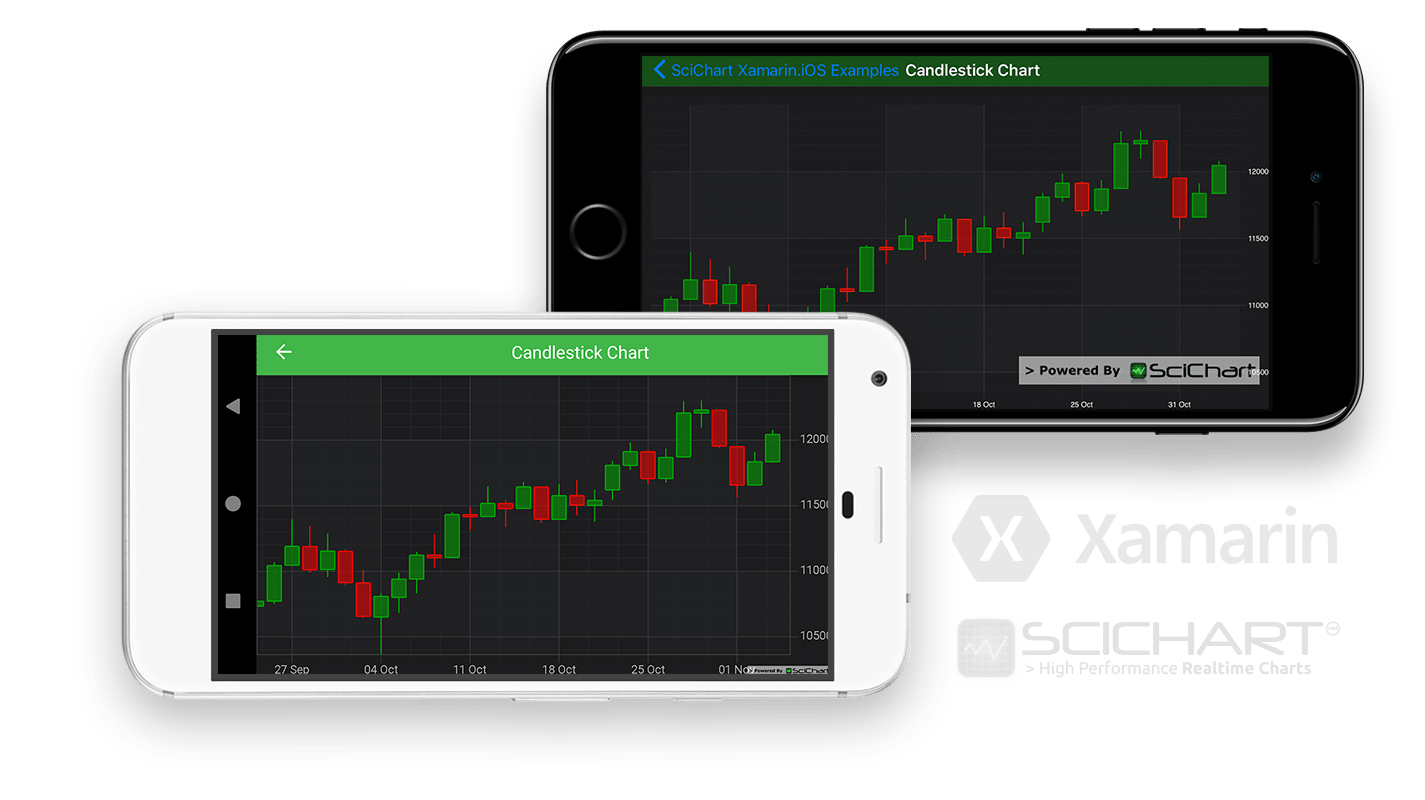
This example demonstrates how to create a CandleStick Chart with Xamarin.iOS and Xamarin.Android for your mobile apps.
The SCIFastCandlestickRenderableSeries in iOS and FastCandlestickRenderableSeries in Android requires a SCIOhlcDataSeries and OhlcDataSeries respectively.
The OhlcDataSeries contains one X-point (Date) and four Y-points (Open, High, Low, Close). Candles are drawn using the UpWick, DownWick, UpBody and DownBody colors, which are used depending on whether Open > Close or not.
Documentation Links
The C#/Xamarin.iOS/Xamarin.Android source code for the Xamarin Candlestick Chart example is included below (Scroll down!).
Did you know you can also view the source code from one of the following sources as well?
- Clone the SciChart.Xamarin.Examples from Github.
- Also, the SciChart for Xamarin Trial contains the full source code for the Xamarin chart examples (link below).


