Xamarin Chart - Examples
Please note! These examples are new to SciChart Mobile v3 release! SciChart iOS & Android ship with Xamarin.iOS and Xamarin.Android bindings around our native iOS & Android Chart controls, allowing you to create fast & feature rich charts to your Xamarin applications. We include ~90 native iOS examples and 90 Android examples, but now also ~60 Xamarin Chart Examples to help you get started with SciChart. You can download the source for our Xamarin Chart Examples from Github, or browse the source code below.
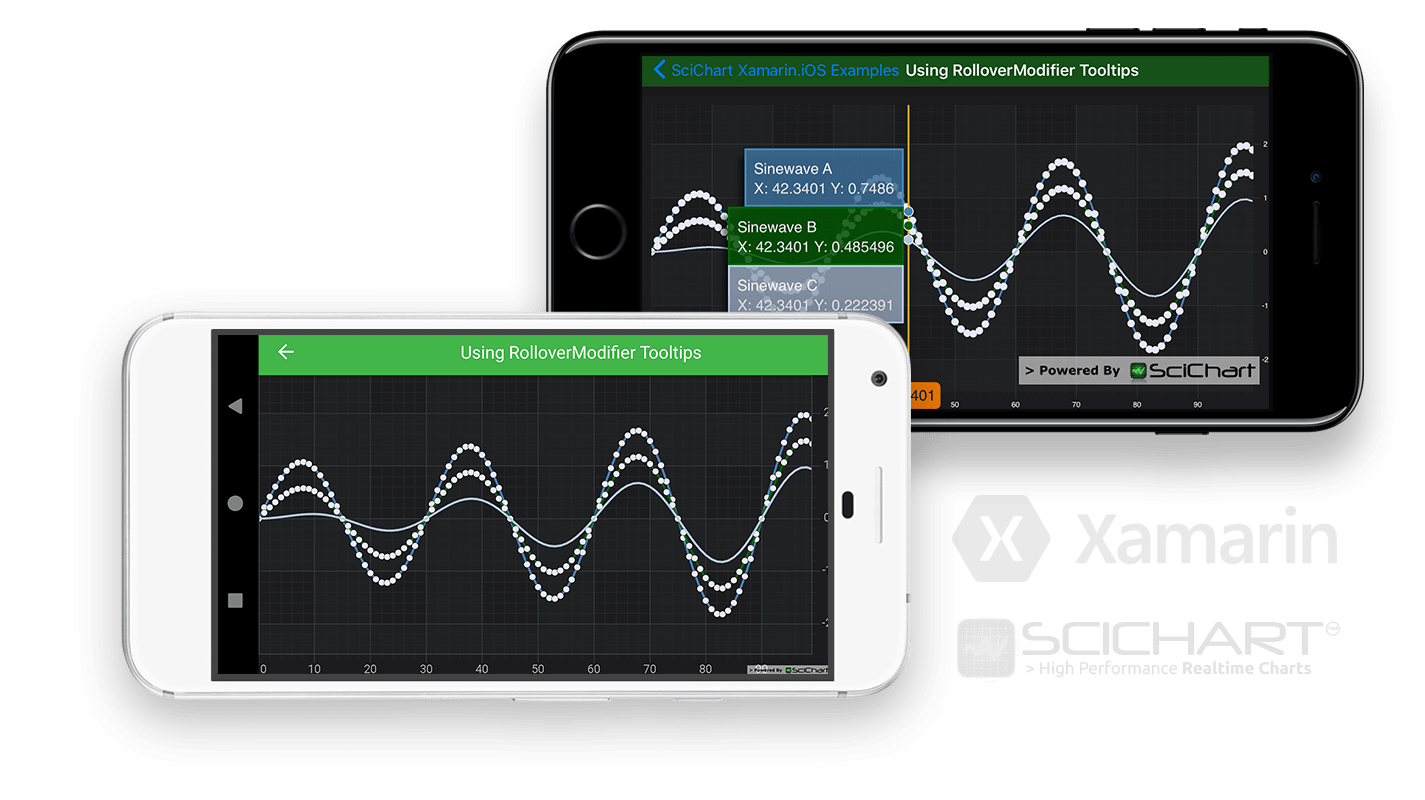
This example demonstrates the RolloverModifier, a ChartModifierBase derived type which adds a vertical line to a Xamarin chart, as well as displaying tooltips for series where the line bi-sects the series.
Alternative modifiers for displaying tooltips on a SciChart Xamarin Chart include the CursorModifier and the TooltipModifier.
See Documentation on how to add tooltips here:
- Tutorial: Adding tooltips to Xamarin Android

The C#/Xamarin.iOS/Xamarin.Android source code for the Xamarin Chart using RolloverModifier Tooltips example is included below (Scroll down!).
Did you know you can also view the source code from one of the following sources as well?
- Clone the SciChart.Xamarin.Examples from Github.
- Also, the SciChart for Xamarin Trial contains the full source code for the Xamarin chart examples (link below).
UsingRolloverModifierTooltipsViewController.cs (Xamarin.iOS)
View source codeusing System;
using CoreGraphics;
using SciChart.iOS.Charting;
using Xamarin.Examples.Demo.Utils;
namespace Xamarin.Examples.Demo.iOS
{
[ExampleDefinition("Using RolloverModifier Tooltips", "Demonstrates Rollover Tooltips", icon: ExampleIcon.Annotations)]
public class UsingRolloverModifierTooltipsViewController : SingleChartViewController<SCIChartSurface>
{
protected override void InitExample()
{
var xAxis = new SCINumericAxis();
var yAxis = new SCINumericAxis { GrowBy = new SCIDoubleRange(0.2, 0.2) };
var ds1 = new XyDataSeries<double, double> { SeriesName = "Sinewave A" };
var ds2 = new XyDataSeries<double, double> { SeriesName = "Sinewave B" };
var ds3 = new XyDataSeries<double, double> { SeriesName = "Sinewave C" };
const double count = 100;
const double k = 2 * Math.PI / 30;
for (var i = 0; i < count; i++)
{
var phi = k * i;
var sin = Math.Sin(phi);
ds1.Append(i, (1.0 + i / count) * sin);
ds2.Append(i, (0.5 + i / count) * sin);
ds3.Append(i, (i / count) * sin);
}
var rs1 = new SCIFastLineRenderableSeries
{
DataSeries = ds1,
StrokeStyle = new SCISolidPenStyle(ColorUtil.SteelBlue, 2f),
PointMarker = new SCIEllipsePointMarker { Size = new CGSize(7, 7), FillStyle = new SCISolidBrushStyle(ColorUtil.Lavender) }
};
var rs2 = new SCIFastLineRenderableSeries
{
DataSeries = ds2,
StrokeStyle = new SCISolidPenStyle(ColorUtil.DarkGreen, 2f),
PointMarker = new SCIEllipsePointMarker { Size = new CGSize(7, 7), FillStyle = new SCISolidBrushStyle(ColorUtil.Lavender) }
};
var rs3 = new SCIFastLineRenderableSeries
{
DataSeries = ds3,
StrokeStyle = new SCISolidPenStyle(ColorUtil.LightSteelBlue, 2f)
};
using (Surface.SuspendUpdates())
{
Surface.XAxes.Add(xAxis);
Surface.YAxes.Add(yAxis);
Surface.RenderableSeries = new SCIRenderableSeriesCollection { rs1, rs2, rs3 };
Surface.ChartModifiers.Add(new SCIRolloverModifier());
SCIAnimations.SweepSeries(rs1, 3, new SCICubicEase());
SCIAnimations.SweepSeries(rs2, 3, new SCICubicEase());
SCIAnimations.SweepSeries(rs3, 3, new SCICubicEase());
}
}
}
}