Xamarin Chart - Examples
Please note! These examples are new to SciChart Mobile v3 release! SciChart iOS & Android ship with Xamarin.iOS and Xamarin.Android bindings around our native iOS & Android Chart controls, allowing you to create fast & feature rich charts to your Xamarin applications. We include ~90 native iOS examples and 90 Android examples, but now also ~60 Xamarin Chart Examples to help you get started with SciChart. You can download the source for our Xamarin Chart Examples from Github, or browse the source code below.
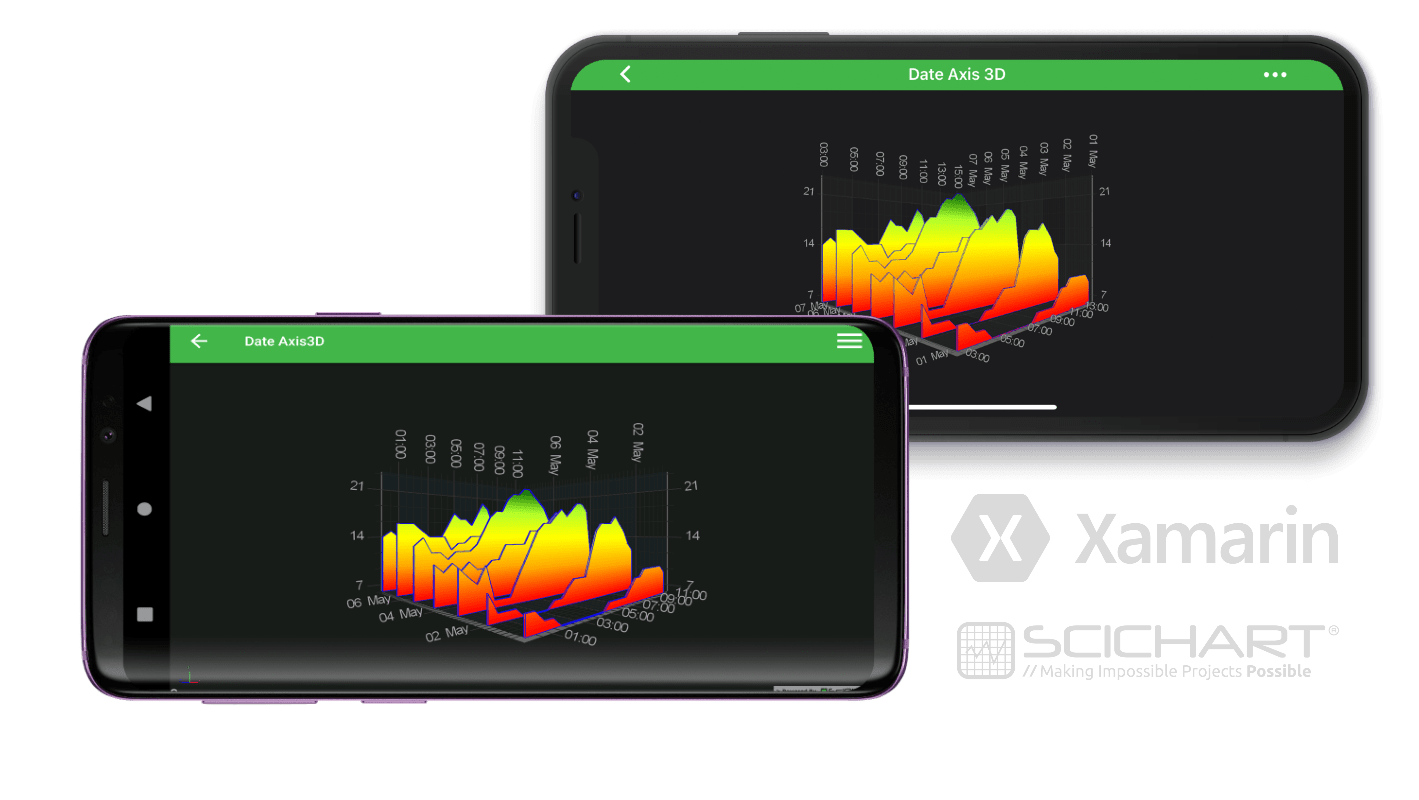
This example demonstrates using one of many different axis types in SciChart, Date Axis with Xamarin.iOS and Xamarin.Android library for charting.See more in the documentation: Axis Types in Android 3D Axis Types in iOS 3D

The full source code for the Xamarin 3D Date Axis example is included below (Scroll down!).
Did you know you can also view the source code from one of the following sources as well?
- Clone the SciChart.Android.Examples from Github.
- Or, view source and export each example to an Android Studio project from the Java version of the SciChart Android Examples app.
- Also the SciChart Android Trial contains the full source for the examples (link below).
DateAxis3DViewController.cs (Xamarin.iOS)
View source codeusing System;
using SciChart.iOS.Charting;
using Xamarin.Examples.Demo.Utils;
namespace Xamarin.Examples.Demo.iOS
{
[Example3DDefinition("Date Axis 3D", description: "Create Chart with Date Axis 3D", icon: ExampleIcon.Axis3D)]
class DateAxis3DViewController : SingleChartViewController<SCIChartSurface3D>
{
protected override void InitExample()
{
const int daysCount = 7;
const int measurementsCount = 24;
var dataSeries3D = new WaterfallDataSeries3D<DateTime, double, DateTime>(measurementsCount, daysCount)
{
StartX = new DateTime(2019, 5, 1),
StepX = SCIDateIntervalUtil.FromMinutes(30).FromUnixTime(),
StartZ = new DateTime(2019, 5, 1),
StepZ = SCIDateIntervalUtil.FromDays(1).FromUnixTime()
};
for (int z = 0; z < daysCount; z++)
{
for (int x = 0; x < measurementsCount; x++)
{
dataSeries3D.UpdateYAt(x, z, Temperatures[z, x]);
}
}
var rSeries3D = new SCIWaterfallRenderableSeries3D
{
DataSeries = dataSeries3D,
Stroke = ColorUtil.Blue,
StrokeThickness = 1f,
SliceThickness = 2f,
YColorMapping = new SCIGradientColorPalette(
new[] { ColorUtil.Red, ColorUtil.Orange, ColorUtil.Yellow, ColorUtil.GreenYellow, ColorUtil.DarkGreen },
new[] { 0, .25f, .5f, .75f, 1 }
)
};
using (Surface.SuspendUpdates())
{
Surface.XAxis = new SCIDateAxis3D { SubDayTextFormatting = "HH:mm", MaxAutoTicks = 8 };
Surface.YAxis = new SCINumericAxis3D{ GrowBy = new SCIDoubleRange(0, 0.1) };
Surface.ZAxis = new SCIDateAxis3D { TextFormatting = "dd MMM", MaxAutoTicks = 5};
Surface.RenderableSeries.Add(rSeries3D);
Surface.ChartModifiers.Add(CreateDefault3DModifiers());
Surface.Camera = new SCICamera3D();
}
}
private static readonly double[,] Temperatures = {
// day 1
{
8, 8, 7, 7, 6, 6, 6, 6,
6, 6, 6, 7, 7, 7, 8, 9,
9, 10, 10, 10, 10, 10, 9, 9
},
// day 2
{
9, 7, 7, 7, 6, 6, 6, 6,
7, 7, 8, 9, 9, 12, 15, 16,
16, 16, 17, 16, 15, 13, 12, 11,
},
// day 3
{
11, 10, 9, 11, 7, 7, 7, 9,
11, 13, 15, 16, 17, 18, 17, 18,
19, 19, 18, 10, 10, 11, 10, 10
},
// day 4
{
11, 10, 11, 10, 11, 10, 10, 11,
11, 13, 13, 13, 15, 15, 15, 16,
17, 18, 17, 17, 15, 13, 12, 11
},
// day 5
{
13, 14, 12, 12, 11, 12, 12, 12,
13, 15, 17, 18, 20, 21, 21, 22,
22, 21, 20, 19, 17, 16, 15, 16
},
// day 6
{
16, 16, 16, 15, 14, 14, 14, 12,
13, 13, 14, 14, 13, 15, 15, 15,
15, 15, 14, 15, 15, 14, 14, 14
},
// day 7
{
14, 15, 14, 13, 14, 13, 13, 14,
14, 16, 18, 17, 16, 18, 20, 19,
16, 16, 16, 16, 15, 14, 13, 12
}
};
}
}DateAxis3DFragment.cs (Xamarin.Android)
View source codeusing SciChart.Charting3D.Model;
using SciChart.Charting3D.Model.DataSeries.Waterfall;
using SciChart.Charting3D.Modifiers;
using SciChart.Charting3D.Visuals;
using SciChart.Charting3D.Visuals.Axes;
using SciChart.Charting3D.Visuals.Camera;
using SciChart.Charting3D.Visuals.RenderableSeries.Data;
using SciChart.Charting3D.Visuals.RenderableSeries.Waterfall;
using SciChart.Core.Utility;
using SciChart.Data.Model;
using Xamarin.Examples.Demo;
using System;
using System.Drawing;
using Xamarin.Examples.Demo.Droid.Extensions;
using Xamarin.Examples.Demo.Droid.Fragments.Base;
namespace Xamarin.Examples.Demo.Droid.Fragments.Examples3D
{
[Example3DDefinition("Date Axis 3D", description: "Create Chart with Date Axis 3D", icon: ExampleIcon.Axis3D)]
class DateAxis3DFragment : ExampleBaseFragment
{
public SciChartSurface3D Surface => View.FindViewById<SciChartSurface3D>(Resource.Id.chart3d);
public override int ExampleLayoutId => Resource.Layout.Example_Single_3D_Chart_Fragment;
protected override void InitExample()
{
const int daysCount = 7;
const int measurementsCount = 24;
var dataSeries3D = new WaterfallDataSeries3D<DateTime, double, DateTime>(measurementsCount, daysCount)
{
StartX = new DateTime(2019, 5, 1),
StepX = DateIntervalUtil.FromMinutes(30).FromUnixTime(),
StartZ = new DateTime(2019, 5, 1),
StepZ = DateIntervalUtil.FromDays(1).FromUnixTime()
};
for (int z = 0; z < daysCount; z++)
{
for (int x = 0; x < measurementsCount; x++)
{
dataSeries3D.UpdateYAt(x, z, Temperatures[z, x]);
}
}
var renderableSeries3D = new WaterfallRenderableSeries3D()
{
DataSeries = dataSeries3D,
StrokeColor = Color.Blue,
StrokeThickness = 1f.ToDip(Activity),
SliceThickness = 2f,
YColorMapping = new GradientColorPalette(
new Color[] { Color.Red, Color.Orange, Color.Yellow, Color.GreenYellow, Color.DarkGreen },
new float[] { 0, .25f, .5f, .75f, 1 }
)
};
using (Surface.SuspendUpdates())
{
Surface.XAxis = new DateAxis3D() { SubDayTextFormatting = "HH:mm", MaxAutoTicks = 8 };
Surface.YAxis = new NumericAxis3D() { GrowBy = new DoubleRange(0, 0.1) };
Surface.ZAxis = new DateAxis3D() { TextFormatting = "dd MMM", MaxAutoTicks = 5};
Surface.Camera = new Camera3D();
Surface.RenderableSeries.Add(renderableSeries3D);
Surface.ChartModifiers = new ChartModifier3DCollection
{
new PinchZoomModifier3D(),
new OrbitModifier3D(),
new ZoomExtentsModifier3D()
};
}
}
private static readonly double[,] Temperatures = new double[,]
{
// day 1
{
8, 8, 7, 7, 6, 6, 6, 6,
6, 6, 6, 7, 7, 7, 8, 9,
9, 10, 10, 10, 10, 10, 9, 9
},
// day 2
{
9, 7, 7, 7, 6, 6, 6, 6,
7, 7, 8, 9, 9, 12, 15, 16,
16, 16, 17, 16, 15, 13, 12, 11,
},
// day 3
{
11, 10, 9, 11, 7, 7, 7, 9,
11, 13, 15, 16, 17, 18, 17, 18,
19, 19, 18, 10, 10, 11, 10, 10
},
// day 4
{
11, 10, 11, 10, 11, 10, 10, 11,
11, 13, 13, 13, 15, 15, 15, 16,
17, 18, 17, 17, 15, 13, 12, 11
},
// day 5
{
13, 14, 12, 12, 11, 12, 12, 12,
13, 15, 17, 18, 20, 21, 21, 22,
22, 21, 20, 19, 17, 16, 15, 16
},
// day 6
{
16, 16, 16, 15, 14, 14, 14, 12,
13, 13, 14, 14, 13, 15, 15, 15,
15, 15, 14, 15, 15, 14, 14, 14
},
// day 7
{
14, 15, 14, 13, 14, 13, 13, 14,
14, 16, 18, 17, 16, 18, 20, 19,
16, 16, 16, 16, 15, 14, 13, 12
}
};
}
}