Xamarin Chart - Examples
Please note! These examples are new to SciChart Mobile v3 release! SciChart iOS & Android ship with Xamarin.iOS and Xamarin.Android bindings around our native iOS & Android Chart controls, allowing you to create fast & feature rich charts to your Xamarin applications. We include ~90 native iOS examples and 90 Android examples, but now also ~60 Xamarin Chart Examples to help you get started with SciChart. You can download the source for our Xamarin Chart Examples from Github, or browse the source code below.
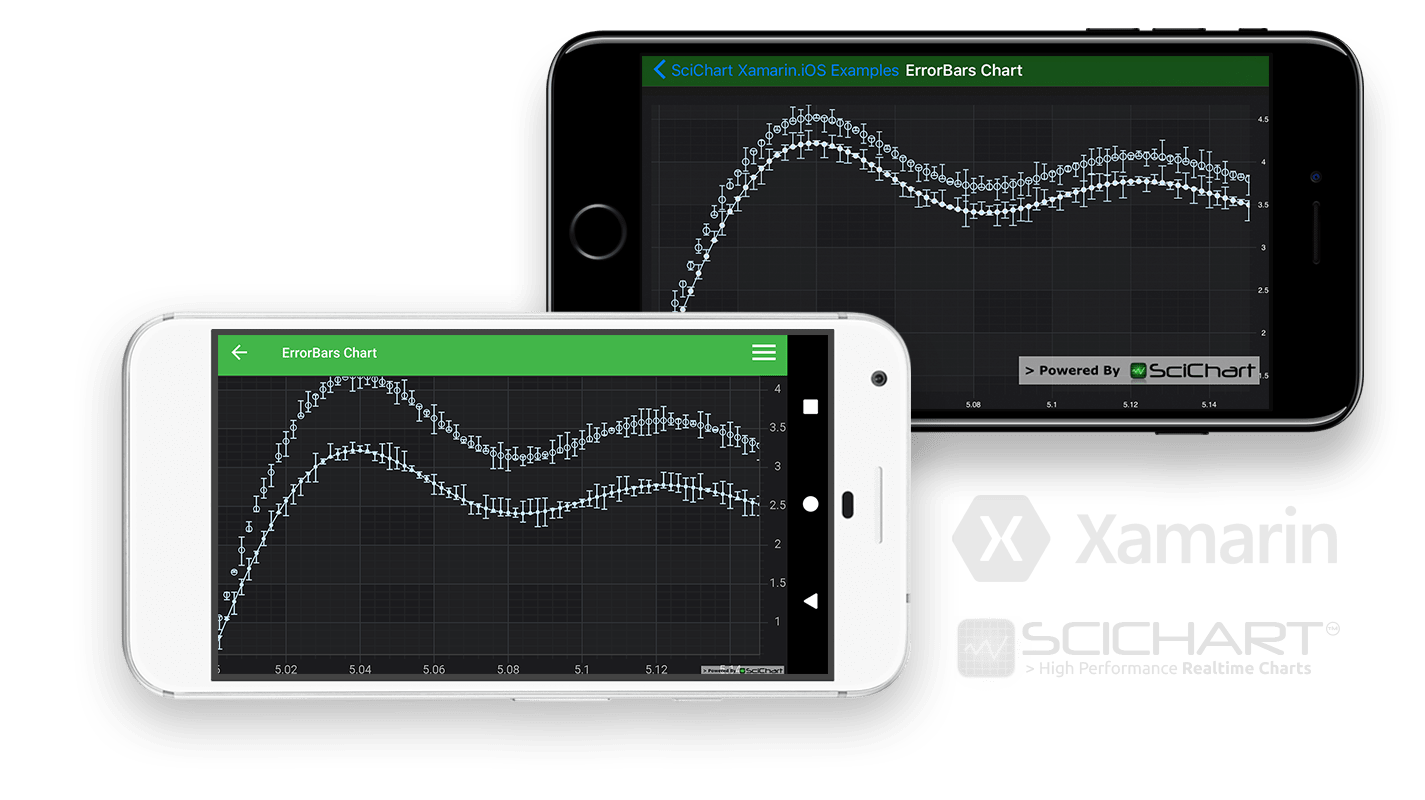
This example demonstrates how to add Error Bars to an existing Xamarin Line or Xamarin Scatter Chart.
In SciChart there are two Error Bar Series types. In native Android these are:
- FastErrorBarsRenderableSeries which can render HlDataSeries or OhlcDataSeries
- FastFixedErrorBarsRenderableSeries which can be used to render an XyDataSeries (which contains one X-point and one Y-point), XyyDataSeries (renders Y values), XyzDataSeries, HlDataSeries and OhlcDataSeries(renders Close values).
In native iOS these are:
- The SCIFastErrorBarsRenderableSeries requires an SCIHlcDataSeries as data source. The High, Low values are used to set the high and low position of the errors, while the Close (Y-value) is the center of the error bar.
- The SCIFixedErrorBarsRenderableSeries. This requires only a SCIXyDataSeries with X,Y values.
Tip!
Error values are fixed and specified by calling setErrorLow() and setErrorHigh() methods. The error can be either Relative or Absolute. You may adjust the width of the Error Bars, by adjusting how much space the bar takes up.

The C#/Xamarin.iOS/Xamarin.Android source code for the Xamarin Error Bars Chart example is included below (Scroll down!).
Did you know you can also view the source code from one of the following sources as well?
- Clone the SciChart.Xamarin.Examples from Github.
- Also, the SciChart for Xamarin Trial contains the full source code for the Xamarin chart examples (link below).
ErrorBarsChartViewController.cs (Xamarin.iOS)
View source codeErrorBarsChartFragment.cs (Xamarin.Android)
View source codeusing System;
using Android.Views.Animations;
using SciChart.Charting.Model;
using SciChart.Charting.Model.DataSeries;
using SciChart.Charting.Modifiers;
using SciChart.Charting.Visuals;
using SciChart.Charting.Visuals.Animations;
using SciChart.Charting.Visuals.Axes;
using SciChart.Charting.Visuals.PointMarkers;
using SciChart.Charting.Visuals.RenderableSeries;
using SciChart.Drawing.Common;
using Xamarin.Examples.Demo.Data;
using Xamarin.Examples.Demo;
using Xamarin.Examples.Demo.Droid.Extensions;
using Xamarin.Examples.Demo.Droid.Fragments.Base;
using Xamarin.Examples.Demo;
using Xamarin.Examples.Demo.Utils;
namespace Xamarin.Examples.Demo.Droid.Fragments.Examples
{
[ExampleDefinition("ErrorBars Chart", description: "Create an ErrorBar Chart", icon: ExampleIcon.ErrorBars)]
public class ErrorBarsChartFragment : ExampleBaseFragment
{
public SciChartSurface Surface => View.FindViewById<SciChartSurface>(Resource.Id.chart);
public override int ExampleLayoutId => Resource.Layout.Example_Single_Chart_Fragment;
protected override void InitExample()
{
var xAxis = new NumericAxis(Activity);
var yAxis = new NumericAxis(Activity);
var fourierSeries = DataManager.Instance.GetFourierSeries(1.0, 0.1, 5.0, 5.15);
var dataSeries0 = new HlDataSeries<double, double>();
var dataSeries1 = new HlDataSeries<double, double>();
FillDataSeries(dataSeries0, fourierSeries, 1.0);
FillDataSeries(dataSeries1, fourierSeries, 1.3);
const uint color = 0xFFC6E6FF;
var strokeStyle = new SolidPenStyle(0xFFC6E6FF, 1f.ToDip(Activity));
var errorBars0 = new FastErrorBarsRenderableSeries()
{
DataSeries = dataSeries0,
StrokeStyle = strokeStyle,
ErrorDirection = ErrorDirection.Vertical,
ErrorType = ErrorType.Absolute
};
var lineSeries = new FastLineRenderableSeries
{
DataSeries = dataSeries0,
StrokeStyle = strokeStyle,
PointMarker = new EllipsePointMarker()
{
FillStyle = new SolidBrushStyle(color),
Width = 5.ToDip(Activity),
Height = 5.ToDip(Activity)
}
};
var errorBars1 = new FastErrorBarsRenderableSeries()
{
DataSeries = dataSeries1,
StrokeStyle = strokeStyle,
ErrorDirection = ErrorDirection.Vertical,
ErrorType = ErrorType.Absolute
};
var scatterSeries = new XyScatterRenderableSeries()
{
DataSeries = dataSeries1,
PointMarker = new EllipsePointMarker()
{
FillStyle = new SolidBrushStyle(ColorUtil.Transparent),
StrokeStyle = strokeStyle,
Width = 7.ToDip(Activity),
Height = 7.ToDip(Activity)
}
};
using (Surface.SuspendUpdates())
{
Surface.XAxes.Add(xAxis);
Surface.YAxes.Add(yAxis);
Surface.RenderableSeries = new RenderableSeriesCollection
{
errorBars0,
lineSeries,
errorBars1,
scatterSeries
};
Surface.ChartModifiers = new ChartModifierCollection
{
new ZoomPanModifier(),
new PinchZoomModifier(),
new ZoomExtentsModifier(),
};
new ScaleAnimatorBuilder(errorBars0) { Interpolator = new OvershootInterpolator(), Duration = 1000, StartDelay = 600}.Start();
new ScaleAnimatorBuilder(lineSeries) { Interpolator = new OvershootInterpolator(), Duration = 1000, StartDelay = 600}.Start();
new ScaleAnimatorBuilder(errorBars1) { Interpolator = new OvershootInterpolator(), Duration = 1000, StartDelay = 600}.Start();
new ScaleAnimatorBuilder(scatterSeries) { Interpolator = new OvershootInterpolator(), Duration = 1000, StartDelay = 600}.Start();
}
}
private static void FillDataSeries(HlDataSeries<double, double> dataSeries, DoubleSeries sourceData, double scale)
{
var random = new Random(42);
var xData = sourceData.XData;
var yData = sourceData.YData;
for (var i = 0; i < sourceData.Count; i++)
{
dataSeries.Append(xData[i], yData[i] + scale, random.NextDouble() * 0.2, random.NextDouble() * 0.2);
}
}
}
}