Xamarin Chart - Examples
Please note! These examples are new to SciChart Mobile v3 release! SciChart iOS & Android ship with Xamarin.iOS and Xamarin.Android bindings around our native iOS & Android Chart controls, allowing you to create fast & feature rich charts to your Xamarin applications. We include ~90 native iOS examples and 90 Android examples, but now also ~60 Xamarin Chart Examples to help you get started with SciChart. You can download the source for our Xamarin Chart Examples from Github, or browse the source code below.
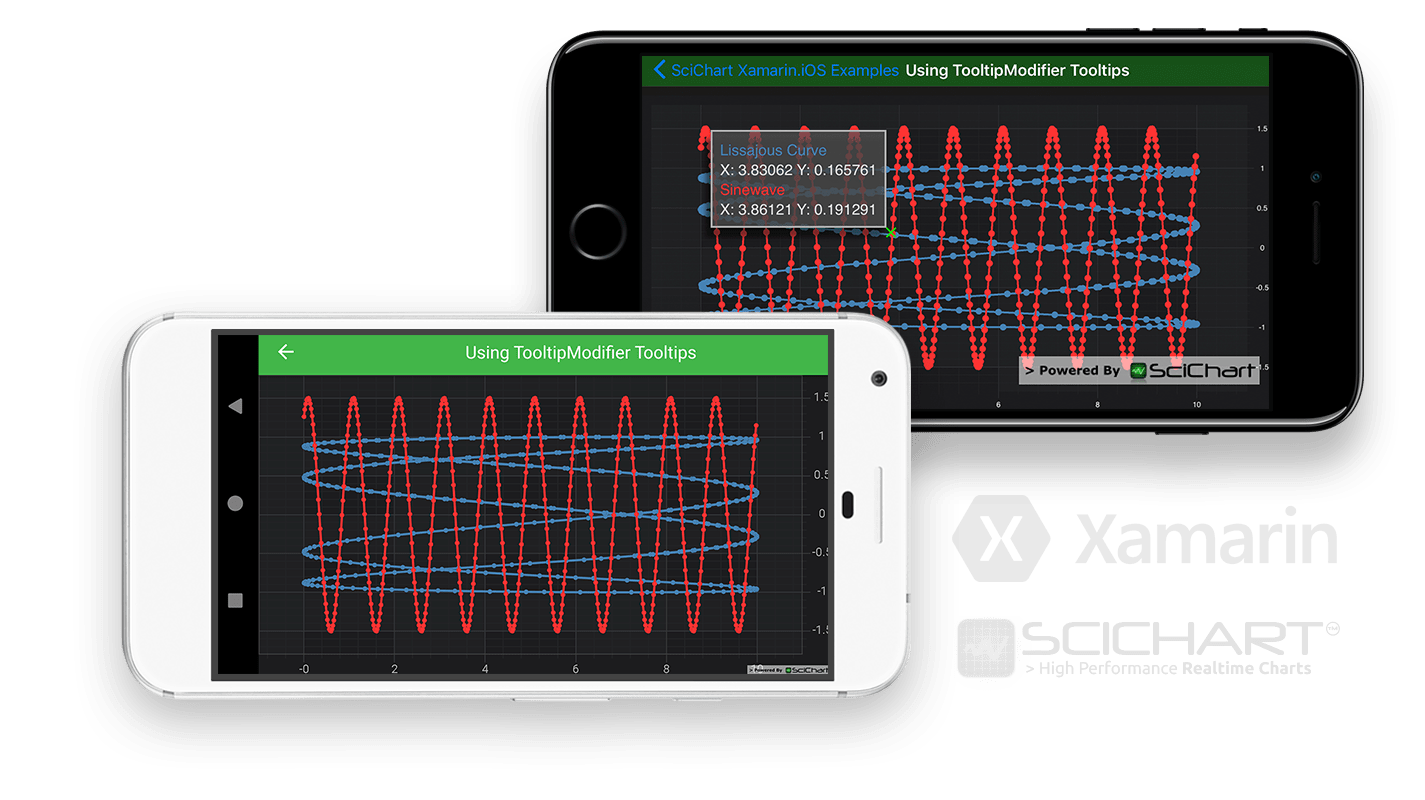
This example demonstrates the TooltipModifier, a ChartModifierBase derived type which allows showing tooltips on touch on a Xamarin chart.
Alternative modifiers for displaying tooltips on a SciChart Xamarin Chart include the RolloverModifier and the CursorModifier.
See Documentation on how to add tooltips here:
- Tutorial: Adding tooltips to Xamarin Android

The C#/Xamarin.iOS/Xamarin.Android source code for the Xamarin Chart using TooltipModifier Tooltips example is included below (Scroll down!).
Did you know you can also view the source code from one of the following sources as well?
- Clone the SciChart.Xamarin.Examples from Github.
- Also, the SciChart for Xamarin Trial contains the full source code for the Xamarin chart examples (link below).
UsingTooltipModifierTooltipsViewController.cs (Xamarin.iOS)
View source codeusing CoreGraphics;
using Xamarin.Examples.Demo.Data;
using SciChart.iOS.Charting;
using Xamarin.Examples.Demo.Utils;
using System.Linq;
namespace Xamarin.Examples.Demo.iOS
{
[ExampleDefinition("Using TooltipModifier Tooltips", description: "Demonstrates a simple tooltip", icon: ExampleIcon.Annotations)]
public class UsingTooltipModifierTooltipsViewController : SingleChartViewController<SCIChartSurface>
{
protected override void InitExample()
{
var xAxis = new SCINumericAxis { GrowBy = new SCIDoubleRange(0.1, 0.1) };
var yAxis = new SCINumericAxis { GrowBy = new SCIDoubleRange(0.1, 0.1) };
var ds1 = new XyDataSeries<double, double> { SeriesName = "Lissajous Curve", AcceptsUnsortedData = true };
var ds2 = new XyDataSeries<double, double> { SeriesName = "Sinewave" };
var ds1Points = DataManager.Instance.GetLissajousCurve(0.8, 0.2, 0.43, 500);
var ds2Points = DataManager.Instance.GetSinewave(1.5, 1.0, 500);
ds1.Append(ds1Points.XData.Select(value => (value + 1) * 5), ds1Points.YData);
ds2.Append(ds2Points.XData, ds2Points.YData);
var line1 = new SCIFastLineRenderableSeries
{
DataSeries = ds1,
StrokeStyle = new SCISolidPenStyle(ColorUtil.SteelBlue, 2f),
PointMarker = new SCIEllipsePointMarker { Size = new CGSize(5, 5), FillStyle = new SCISolidBrushStyle(ColorUtil.SteelBlue) }
};
var line2 = new SCIFastLineRenderableSeries
{
DataSeries = ds2,
StrokeStyle = new SCISolidPenStyle(0xFFFF3333, 2f),
PointMarker = new SCIEllipsePointMarker { Size = new CGSize(5, 5), FillStyle = new SCISolidBrushStyle(0xFFFF3333) }
};
using (Surface.SuspendUpdates())
{
Surface.XAxes.Add(xAxis);
Surface.YAxes.Add(yAxis);
Surface.RenderableSeries.Add(line1);
Surface.RenderableSeries.Add(line2);
Surface.ChartModifiers.Add(new SCITooltipModifier());
SCIAnimations.FadeSeries(line1, 3, new SCICubicEase());
SCIAnimations.FadeSeries(line2, 3, new SCICubicEase());
}
}
}
}UsingTooltipModifierTooltipsFragment.cs (Xamarin.Android)
View source codeusing System.Collections.Generic;
using Android.Views.Animations;
using SciChart.Charting.Model;
using SciChart.Charting.Model.DataSeries;
using SciChart.Charting.Modifiers;
using SciChart.Charting.Visuals;
using SciChart.Charting.Visuals.Animations;
using SciChart.Charting.Visuals.Axes;
using SciChart.Charting.Visuals.PointMarkers;
using SciChart.Charting.Visuals.RenderableSeries;
using SciChart.Data.Model;
using SciChart.Drawing.Common;
using Xamarin.Examples.Demo.Data;
using Xamarin.Examples.Demo;
using Xamarin.Examples.Demo.Droid.Extensions;
using Xamarin.Examples.Demo.Droid.Fragments.Base;
using Xamarin.Examples.Demo;
using Xamarin.Examples.Demo.Utils;
namespace Xamarin.Examples.Demo.Droid.Fragments.Examples
{
[ExampleDefinition("Using TooltipModifier Tooltips", description: "Demonstrates a simple tooltip", icon: ExampleIcon.Annotations)]
public class UsingTooltipModifierTooltipsFragment : ExampleBaseFragment
{
public override int ExampleLayoutId => Resource.Layout.Example_Single_Chart_Fragment;
public SciChartSurface Surface => View.FindViewById<SciChartSurface>(Resource.Id.chart);
protected override void InitExample()
{
var xAxis = new NumericAxis(Activity) {GrowBy = new DoubleRange(0.1, 0.1)};
var yAxis = new NumericAxis(Activity) {GrowBy = new DoubleRange(0.1, 0.1)};
var ds1 = new XyDataSeries<double, double> {SeriesName = "Lissajous Curve", AcceptsUnsortedData = true};
var ds2 = new XyDataSeries<double, double> {SeriesName = "Sinewave", AcceptsUnsortedData = true};
var ds1Points = DataManager.Instance.GetLissajousCurve(0.8, 0.2, 0.43, 500);
var ds2Points = DataManager.Instance.GetSinewave(1.5, 1.0, 500);
var scaledXValues = GetScaledValues(ds1Points.XData);
ds1.Append(scaledXValues, ds1Points.YData);
ds2.Append(ds2Points.XData, ds2Points.YData);
var rs1 = new FastLineRenderableSeries
{
DataSeries = ds1,
StrokeStyle = new SolidPenStyle(ColorUtil.SteelBlue, 2f.ToDip(Activity)),
PointMarker = new EllipsePointMarker
{
Width = 5.ToDip(Activity),
Height = 5.ToDip(Activity),
StrokeStyle = new SolidPenStyle(ColorUtil.SteelBlue, 2f.ToDip(Activity)),
FillStyle = new SolidBrushStyle(ColorUtil.SteelBlue)
}
};
var rs2 = new FastLineRenderableSeries
{
DataSeries = ds2,
StrokeStyle = new SolidPenStyle(0xFFFF3333, 2f.ToDip(Activity)),
PointMarker = new EllipsePointMarker
{
Width = 5.ToDip(Activity),
Height = 5.ToDip(Activity),
StrokeStyle = new SolidPenStyle(0xFFFF3333, 2f.ToDip(Activity)),
FillStyle = new SolidBrushStyle(0xFFFF3333)
}
};
using (Surface.SuspendUpdates())
{
Surface.XAxes.Add(xAxis);
Surface.YAxes.Add(yAxis);
Surface.RenderableSeries = new RenderableSeriesCollection { rs1, rs2 };
Surface.ChartModifiers.Add(new TooltipModifier {UseInterpolation = true});
new OpacityAnimatorBuilder(rs1) { Duration = 1000, StartDelay = 600 }.Start();
new OpacityAnimatorBuilder(rs2) { Duration = 1000, StartDelay = 600 }.Start();
}
}
private static IList<double> GetScaledValues(IList<double> values)
{
var size = values.Count;
var scaledValues = new List<double>(size);
for (var i = 0; i < size; i++)
{
var value = values[i];
scaledValues.Add((value + 1)*5);
}
return scaledValues;
}
}
}