Xamarin Chart - Examples
Please note! These examples are new to SciChart Mobile v3 release! SciChart iOS & Android ship with Xamarin.iOS and Xamarin.Android bindings around our native iOS & Android Chart controls, allowing you to create fast & feature rich charts to your Xamarin applications. We include ~90 native iOS examples and 90 Android examples, but now also ~60 Xamarin Chart Examples to help you get started with SciChart. You can download the source for our Xamarin Chart Examples from Github, or browse the source code below.
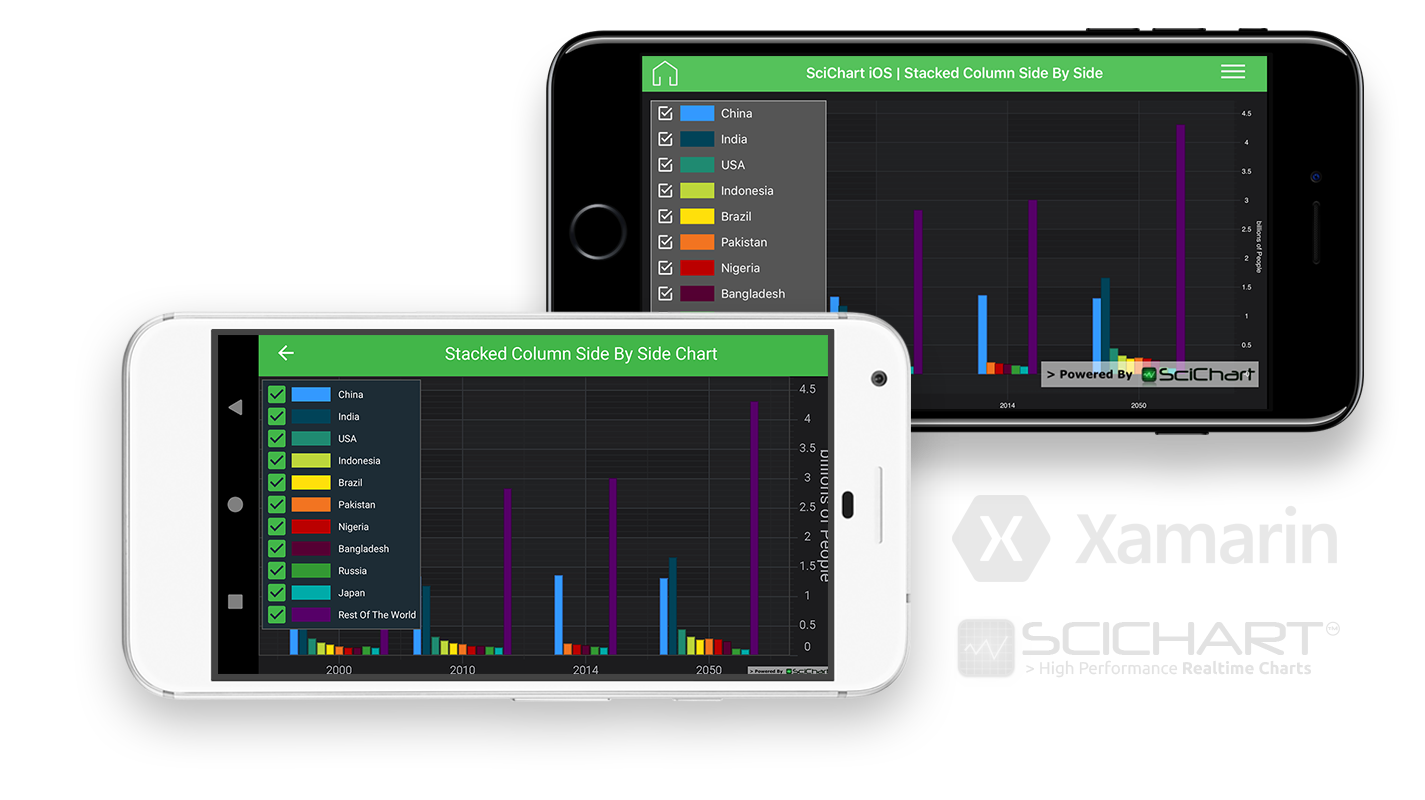
This example demonstrates how to create Xamarin Stacked Column Chart, grouped Side by Side in code.
Stacked Column Charts or a Clustered chart is very popular in Sales Dashboards. This chart type is a great tool to indicate relationships in the structure of data: compare between each element in the categories, and to compare elements across categories.
Grouping is performed when you place multiple StackedColumnRenderableSeries (SciChart Android) or SCIStackedColumnRenderableSeries (SciChart iOS) into a VerticallyStackedColumnsCollection, SCIVerticallyStackedColumnsCollection correspondingly.
Series may also be placed into the HorizontallyStackedColumnsCollection (SciChart Android) or SCIHorizontallyStackedColumnsCollection (Scichart iOS) for horizontal grouping. This allows columns to be rendered stacked one above another or side by side.
See Documentation on how to use this type in native SciChart:

The C#/Xamarin.iOS/Xamarin.Android source code for the Xamarin Stacked (Grouped) Column Chart Side by Side example is included below (Scroll down!).
Did you know you can also view the source code from one of the following sources as well?
- Clone the SciChart.Xamarin.Examples from Github.
- Also, the SciChart for Xamarin Trial contains the full source code for the Xamarin chart examples (link below).
StackedColumnSideBySideViewController.cs (Xamarin.iOS)
View source codeStackedColumnSideBySideFragment.cs (Xamarin.Android)
View source codeusing Android.Views;
using Android.Views.Animations;
using Java.Lang;
using SciChart.Charting.Model.DataSeries;
using SciChart.Charting.Modifiers;
using SciChart.Charting.Numerics.LabelProviders;
using SciChart.Charting.Visuals;
using SciChart.Charting.Visuals.Animations;
using SciChart.Charting.Visuals.Axes;
using SciChart.Charting.Visuals.RenderableSeries;
using SciChart.Core.Utility;
using SciChart.Data.Model;
using SciChart.Drawing.Common;
using Xamarin.Examples.Demo;
using Xamarin.Examples.Demo.Droid.Fragments.Base;
namespace Xamarin.Examples.Demo.Droid.Fragments.Examples
{
[ExampleDefinition("Stacked Column Side By Side Chart", description: "A Stacked Column chart with columns grouped side by side", icon: ExampleIcon.StackedColumn)]
public class StackedColumnSideBySideFragment : ExampleBaseFragment
{
public SciChartSurface Surface => View.FindViewById<SciChartSurface>(Resource.Id.chart);
public override int ExampleLayoutId => Resource.Layout.Example_Single_Chart_Fragment;
protected override void InitExample()
{
var xAxis = new NumericAxis(Activity)
{
AutoTicks = false,
MajorDelta = 1d.FromComparable(),
MinorDelta = 0.5d.FromComparable(),
DrawMajorBands = true,
LabelProvider = new YearsLabelProvider(),
};
var yAxis = new NumericAxis(Activity)
{
AutoRange = AutoRange.Always,
AxisTitle = "billions of People",
GrowBy = new DoubleRange(0, 0.1),
DrawMajorBands = true,
};
var china = new[] {1.269, 1.330, 1.356, 1.304};
var india = new[] {1.004, 1.173, 1.236, 1.656};
var usa = new[] {0.282, 0.310, 0.319, 0.439};
var indonesia = new[] {0.214, 0.243, 0.254, 0.313};
var brazil = new[] {0.176, 0.201, 0.203, 0.261};
var pakistan = new[] {0.146, 0.184, 0.196, 0.276};
var nigeria = new[] {0.123, 0.152, 0.177, 0.264};
var bangladesh = new[] {0.130, 0.156, 0.166, 0.234};
var russia = new[] {0.147, 0.139, 0.142, 0.109};
var japan = new[] {0.126, 0.127, 0.127, 0.094};
var restOfTheWorld = new[] {2.466, 2.829, 3.005, 4.306};
var chinaDataSeries = new XyDataSeries<double, double> {SeriesName = "China"};
var indiaDataSeries = new XyDataSeries<double, double> {SeriesName = "India"};
var usaDataSeries = new XyDataSeries<double, double> {SeriesName = "USA"};
var indonesiaDataSeries = new XyDataSeries<double, double> {SeriesName = "Indonesia"};
var brazilDataSeries = new XyDataSeries<double, double> {SeriesName = "Brazil"};
var pakistanDataSeries = new XyDataSeries<double, double> {SeriesName = "Pakistan"};
var nigeriaDataSeries = new XyDataSeries<double, double> {SeriesName = "Nigeria"};
var bangladeshDataSeries = new XyDataSeries<double, double> {SeriesName = "Bangladesh"};
var russiaDataSeries = new XyDataSeries<double, double> {SeriesName = "Russia"};
var japanDataSeries = new XyDataSeries<double, double> {SeriesName = "Japan"};
var restOfTheWorldDataSeries = new XyDataSeries<double, double> {SeriesName = "Rest Of The World"};
var totalDataSeries = new XyDataSeries<double, double> {SeriesName = "Total"};
for (var i = 0; i < 4; i++)
{
double xValue = i;
chinaDataSeries.Append(xValue, china[i]);
if (i != 2)
{
indiaDataSeries.Append(xValue, india[i]);
usaDataSeries.Append(xValue, usa[i]);
indonesiaDataSeries.Append(xValue, indonesia[i]);
brazilDataSeries.Append(xValue, brazil[i]);
}
else
{
indiaDataSeries.Append(xValue, Double.NaN);
usaDataSeries.Append(xValue, Double.NaN);
indonesiaDataSeries.Append(xValue, Double.NaN);
brazilDataSeries.Append(xValue, Double.NaN);
}
pakistanDataSeries.Append(xValue, pakistan[i]);
nigeriaDataSeries.Append(xValue, nigeria[i]);
bangladeshDataSeries.Append(xValue, bangladesh[i]);
russiaDataSeries.Append(xValue, russia[i]);
japanDataSeries.Append(xValue, japan[i]);
restOfTheWorldDataSeries.Append(xValue, restOfTheWorld[i]);
totalDataSeries.Append(xValue, china[i] + india[i] + usa[i] + indonesia[i] + brazil[i] + pakistan[i] + nigeria[i] + bangladesh[i] + russia[i] + japan[i] + restOfTheWorld[i]);
}
var rs1 = GetRenderableSeries(chinaDataSeries, 0xff3399ff, 0xff2D68BC);
var rs2 = GetRenderableSeries(indiaDataSeries, 0xff014358, 0xff013547);
var rs3 = GetRenderableSeries(usaDataSeries, 0xff1f8a71, 0xff1B5D46);
var rs4 = GetRenderableSeries(indonesiaDataSeries, 0xffbdd63b, 0xff7E952B);
var rs5 = GetRenderableSeries(brazilDataSeries, 0xffffe00b, 0xffAA8F0B);
var rs6 = GetRenderableSeries(pakistanDataSeries, 0xfff27421, 0xffA95419);
var rs7 = GetRenderableSeries(nigeriaDataSeries, 0xffbb0000, 0xff840000);
var rs8 = GetRenderableSeries(bangladeshDataSeries, 0xff550033, 0xff370018);
var rs9 = GetRenderableSeries(russiaDataSeries, 0xff339933, 0xff2D732D);
var rs10 = GetRenderableSeries(japanDataSeries, 0xff00aba9, 0xff006C6A);
var rs11 = GetRenderableSeries(restOfTheWorldDataSeries, 0xff560068, 0xff3D0049);
var columnsCollection = new HorizontallyStackedColumnsCollection();
columnsCollection.Add(rs1);
columnsCollection.Add(rs2);
columnsCollection.Add(rs3);
columnsCollection.Add(rs4);
columnsCollection.Add(rs5);
columnsCollection.Add(rs6);
columnsCollection.Add(rs7);
columnsCollection.Add(rs8);
columnsCollection.Add(rs9);
columnsCollection.Add(rs10);
columnsCollection.Add(rs11);
var legendModifier = new LegendModifier(Activity);
legendModifier.SetLegendPosition(GravityFlags.Top | GravityFlags.Left, 10);
using (Surface.SuspendUpdates())
{
Surface.XAxes.Add(xAxis);
Surface.YAxes.Add(yAxis);
Surface.RenderableSeries.Add(columnsCollection);
Surface.ChartModifiers.Add(legendModifier);
Surface.ChartModifiers.Add(new TooltipModifier());
}
new WaveAnimatorBuilder(rs1) { Interpolator = new DecelerateInterpolator(), Duration = 3000, StartDelay = 350 }.Start();
new WaveAnimatorBuilder(rs2) { Interpolator = new DecelerateInterpolator(), Duration = 3000, StartDelay = 350 }.Start();
new WaveAnimatorBuilder(rs3) { Interpolator = new DecelerateInterpolator(), Duration = 3000, StartDelay = 350 }.Start();
new WaveAnimatorBuilder(rs4) { Interpolator = new DecelerateInterpolator(), Duration = 3000, StartDelay = 350 }.Start();
new WaveAnimatorBuilder(rs5) { Interpolator = new DecelerateInterpolator(), Duration = 3000, StartDelay = 350 }.Start();
new WaveAnimatorBuilder(rs6) { Interpolator = new DecelerateInterpolator(), Duration = 3000, StartDelay = 350 }.Start();
new WaveAnimatorBuilder(rs7) { Interpolator = new DecelerateInterpolator(), Duration = 3000, StartDelay = 350 }.Start();
new WaveAnimatorBuilder(rs8) { Interpolator = new DecelerateInterpolator(), Duration = 3000, StartDelay = 350 }.Start();
new WaveAnimatorBuilder(rs9) { Interpolator = new DecelerateInterpolator(), Duration = 3000, StartDelay = 350 }.Start();
new WaveAnimatorBuilder(rs10) { Interpolator = new DecelerateInterpolator(), Duration = 3000, StartDelay = 350 }.Start();
new WaveAnimatorBuilder(rs11) { Interpolator = new DecelerateInterpolator(), Duration = 3000, StartDelay = 350 }.Start();
}
private StackedColumnRenderableSeries GetRenderableSeries(IDataSeries dataSeries, uint fillColor, uint strokeColor)
{
return new StackedColumnRenderableSeries
{
DataSeries = dataSeries,
StrokeStyle = new SolidPenStyle(Activity, strokeColor),
FillBrushStyle = new SolidBrushStyle(fillColor)
};
}
}
class YearsLabelFormatter : Object, ILabelFormatter
{
private readonly string[] _xLabels = {"2000", "2010", "2014", "2050"};
public void Update(Object axis)
{
}
public ICharSequence FormatLabelFormatted(double dataValue)
{
var i = (int) dataValue;
var result = "";
if (i >= 0 && i < 4)
{
result = _xLabels[i];
}
return new String(result);
}
public ICharSequence FormatCursorLabelFormatted(double dataValue)
{
var i = (int) dataValue;
string result;
if (i >= 0 && i < 4)
{
result = _xLabels[i];
}
else if (i < 0)
{
result = _xLabels[0];
}
else
{
result = _xLabels[3];
}
return new String(result);
}
}
class YearsLabelProvider : FormatterLabelProviderBase
{
public YearsLabelProvider() : base(typeof (NumericAxis).ToClass(), new YearsLabelFormatter())
{
}
}
}