Xamarin Chart - Examples
Please note! These examples are new to SciChart Mobile v3 release! SciChart iOS & Android ship with Xamarin.iOS and Xamarin.Android bindings around our native iOS & Android Chart controls, allowing you to create fast & feature rich charts to your Xamarin applications. We include ~90 native iOS examples and 90 Android examples, but now also ~60 Xamarin Chart Examples to help you get started with SciChart. You can download the source for our Xamarin Chart Examples from Github, or browse the source code below.
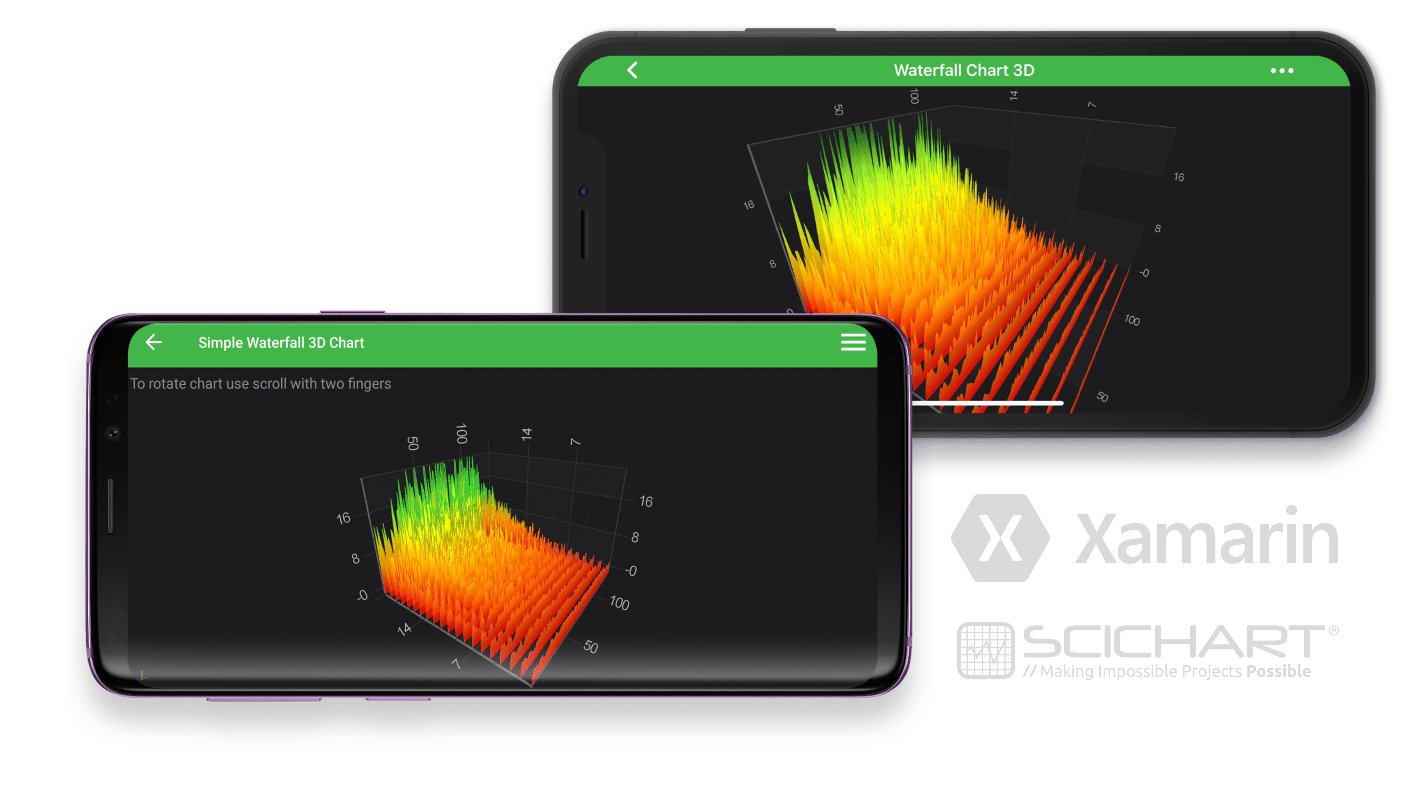
This is an example of Waterfall 3D Chart created with SciChart Xamarin.iOS and Xamarin.Android.
See more in the documentation:
Create a 3D Chart with Xamarin.Android
Create a 3D Chart with Xamarin.iOS

The C#/Xamarin.iOS/Xamarin.Android source code for the Xamarin Simple Waterfall 3D Chart example is included below (Scroll down!).
Did you know you can also view the source code from one of the following sources as well?
- Clone the SciChart.Xamarin.Examples from Github.
- Also, the SciChart for Xamarin Trial contains the full source code for the Xamarin chart examples (link below).
Waterfall3DChartViewController.cs (Xamarin.iOS)
View source codeusing Xamarin.Examples.Demo.Data;
using SciChart.iOS.Charting;
using Xamarin.Examples.Demo.Utils;
namespace Xamarin.Examples.Demo.iOS
{
[Example3DDefinition("Waterfall 3D Chart", description: "Create a simple Waterfall 3D Chart", icon: ExampleIcon.Surface3D)]
class CreateWaterfall3DChartViewController : SingleChartViewController<SCIChartSurface3D>
{
protected override void InitExample()
{
var data = DataManager.Instance.LoadWaterfallData();
var sliceCount = data.Count;
var pointsPerSlice = data[0].Count;
var dataSeries3D = new WaterfallDataSeries3D<double, double, double>(pointsPerSlice, sliceCount) { StartX = 10d, StepX = 1d, StartZ = 1d };
for (int i = 0; i < sliceCount; i++)
{
dataSeries3D.SetRowAt(i, data[i]);
}
var rSeries3D = new SCIWaterfallRenderableSeries3D
{
DataSeries = dataSeries3D,
StrokeThickness = 1f,
SliceThickness = 0f,
YColorMapping = new SCIGradientColorPalette(
new[] { ColorUtil.Red, ColorUtil.Orange, ColorUtil.Yellow, ColorUtil.GreenYellow, ColorUtil.DarkGreen },
new[] { 0, .25f, .5f, .75f, 1 }),
YStrokeColorMapping = new SCIGradientColorPalette(
new[] { ColorUtil.Crimson, ColorUtil.DarkOrange, ColorUtil.LimeGreen, ColorUtil.LimeGreen },
new[] { 0, 0.33f, 0.67f, 1 }),
Opacity = 0.8f,
};
using (Surface.SuspendUpdates())
{
Surface.XAxis = new SCINumericAxis3D();
Surface.YAxis = new SCINumericAxis3D();
Surface.ZAxis = new SCINumericAxis3D();
Surface.RenderableSeries.Add(rSeries3D);
Surface.ChartModifiers.Add(CreateDefault3DModifiers());
}
}
}
}CreateRealtimeWaterfall3DChartFragment.cs (Xamarin.Android)
View source codeusing SciChart.Charting3D.Model;
using SciChart.Charting3D.Model.DataSeries.Waterfall;
using SciChart.Charting3D.Modifiers;
using SciChart.Charting3D.Visuals;
using SciChart.Charting3D.Visuals.Axes;
using SciChart.Charting3D.Visuals.Camera;
using SciChart.Charting3D.Visuals.RenderableSeries.Data;
using SciChart.Charting3D.Visuals.RenderableSeries.Waterfall;
using Xamarin.Examples.Demo.Data;
using Xamarin.Examples.Demo;
using System.Collections.Generic;
using System.Drawing;
using System.Timers;
using Xamarin.Examples.Demo.Droid.Extensions;
using Xamarin.Examples.Demo.Droid.Fragments.Base;
namespace Xamarin.Examples.Demo.Droid.Fragments.Examples3D
{
[Example3DDefinition("Realtime Waterfall 3D", description: "Update a Waterfall Chart in real-time", icon: ExampleIcon.RealTime)]
class CreateRealtimeWaterfall3DChartFragment : ExampleBaseFragment
{
private const int PointsPerSlice = 128;
private const int SliceCount = 10;
public SciChartSurface3D Surface => View.FindViewById<SciChartSurface3D>(Resource.Id.chart3d);
public override int ExampleLayoutId => Resource.Layout.Example_Single_3D_Chart_Fragment;
private const int TimerInterval = 25;
private volatile bool _isRunning = false;
private readonly object _syncRoot = new object();
private Timer _timer;
private int _tick = 0;
private List<List<double>> _fftData;
private readonly WaterfallDataSeries3D<double, double, double> _dataSeries3D = new WaterfallDataSeries3D<double, double, double>(PointsPerSlice, SliceCount)
{
StartX = 10d,
StepX = 1d,
StartZ = 25d,
StepZ = 10d
};
protected override void InitExample()
{
_fftData = DataManager.Instance.LoadFFT();
FillDataSeries(_dataSeries3D);
var renderableSeries3D = new WaterfallRenderableSeries3D()
{
DataSeries = _dataSeries3D,
StrokeThickness = 1f.ToDip(Activity),
SliceThickness = 5f,
YColorMapping = new GradientColorPalette(
new Color[] { Color.Red, Color.Orange, Color.Yellow, Color.GreenYellow, Color.DarkGreen },
new float[] { 0, .25f, .5f, .75f, 1 }),
YStrokeColorMapping = new GradientColorPalette(
new Color[] { Color.Crimson, Color.DarkOrange, Color.LimeGreen, Color.LimeGreen },
new float[] { 0, 0.33f, 0.67f, 1 }),
Opacity = 0.8f
};
using (Surface.SuspendUpdates())
{
Surface.XAxis = new NumericAxis3D();
Surface.YAxis = new NumericAxis3D();
Surface.ZAxis = new NumericAxis3D();
Surface.Camera = new Camera3D();
Surface.RenderableSeries.Add(renderableSeries3D);
Surface.ChartModifiers = new ChartModifier3DCollection
{
new PinchZoomModifier3D(),
new OrbitModifier3D(),
new ZoomExtentsModifier3D()
};
}
Start();
}
private void Start()
{
if (_isRunning) return;
_isRunning = true;
_timer = new Timer(TimerInterval);
_timer.Elapsed += OnTick;
_timer.AutoReset = true;
_timer.Start();
}
private void OnTick(object sender, ElapsedEventArgs e)
{
lock (_syncRoot)
{
if (!_isRunning) return;
FillDataSeries(_dataSeries3D);
}
}
private void FillDataSeries(WaterfallDataSeries3D<double, double, double> ds)
{
var index = _tick++ % _fftData.Count;
ds.PushRow(_fftData[index]);
}
public override void OnDestroyView()
{
base.OnDestroyView();
Pause();
}
private void Pause()
{
if (!_isRunning) return;
_isRunning = false;
_timer.Stop();
_timer.Elapsed -= OnTick;
_timer = null;
}
}
}