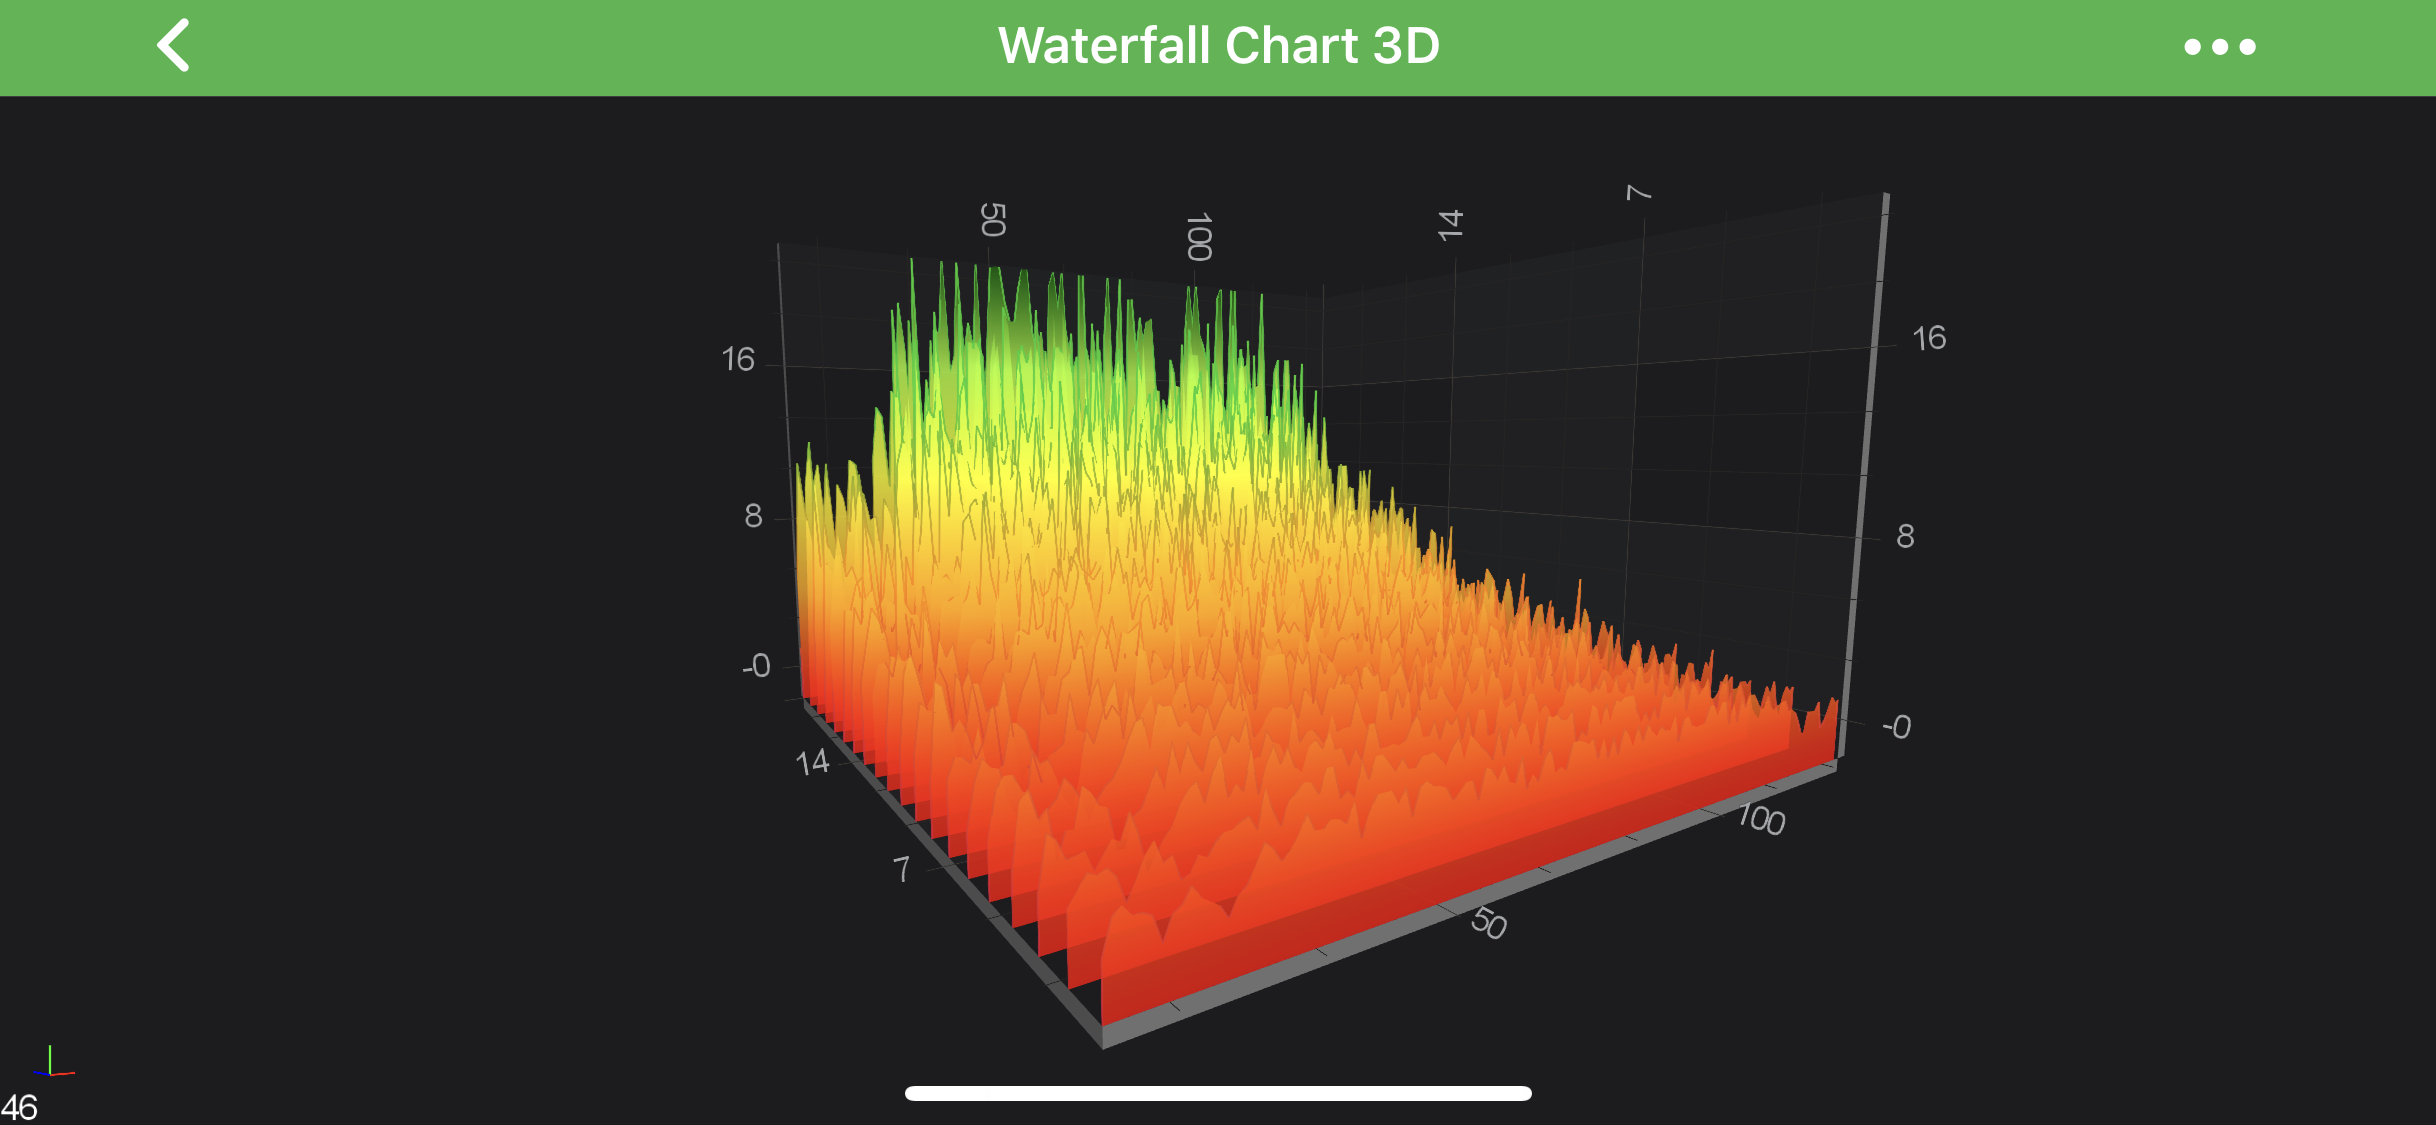
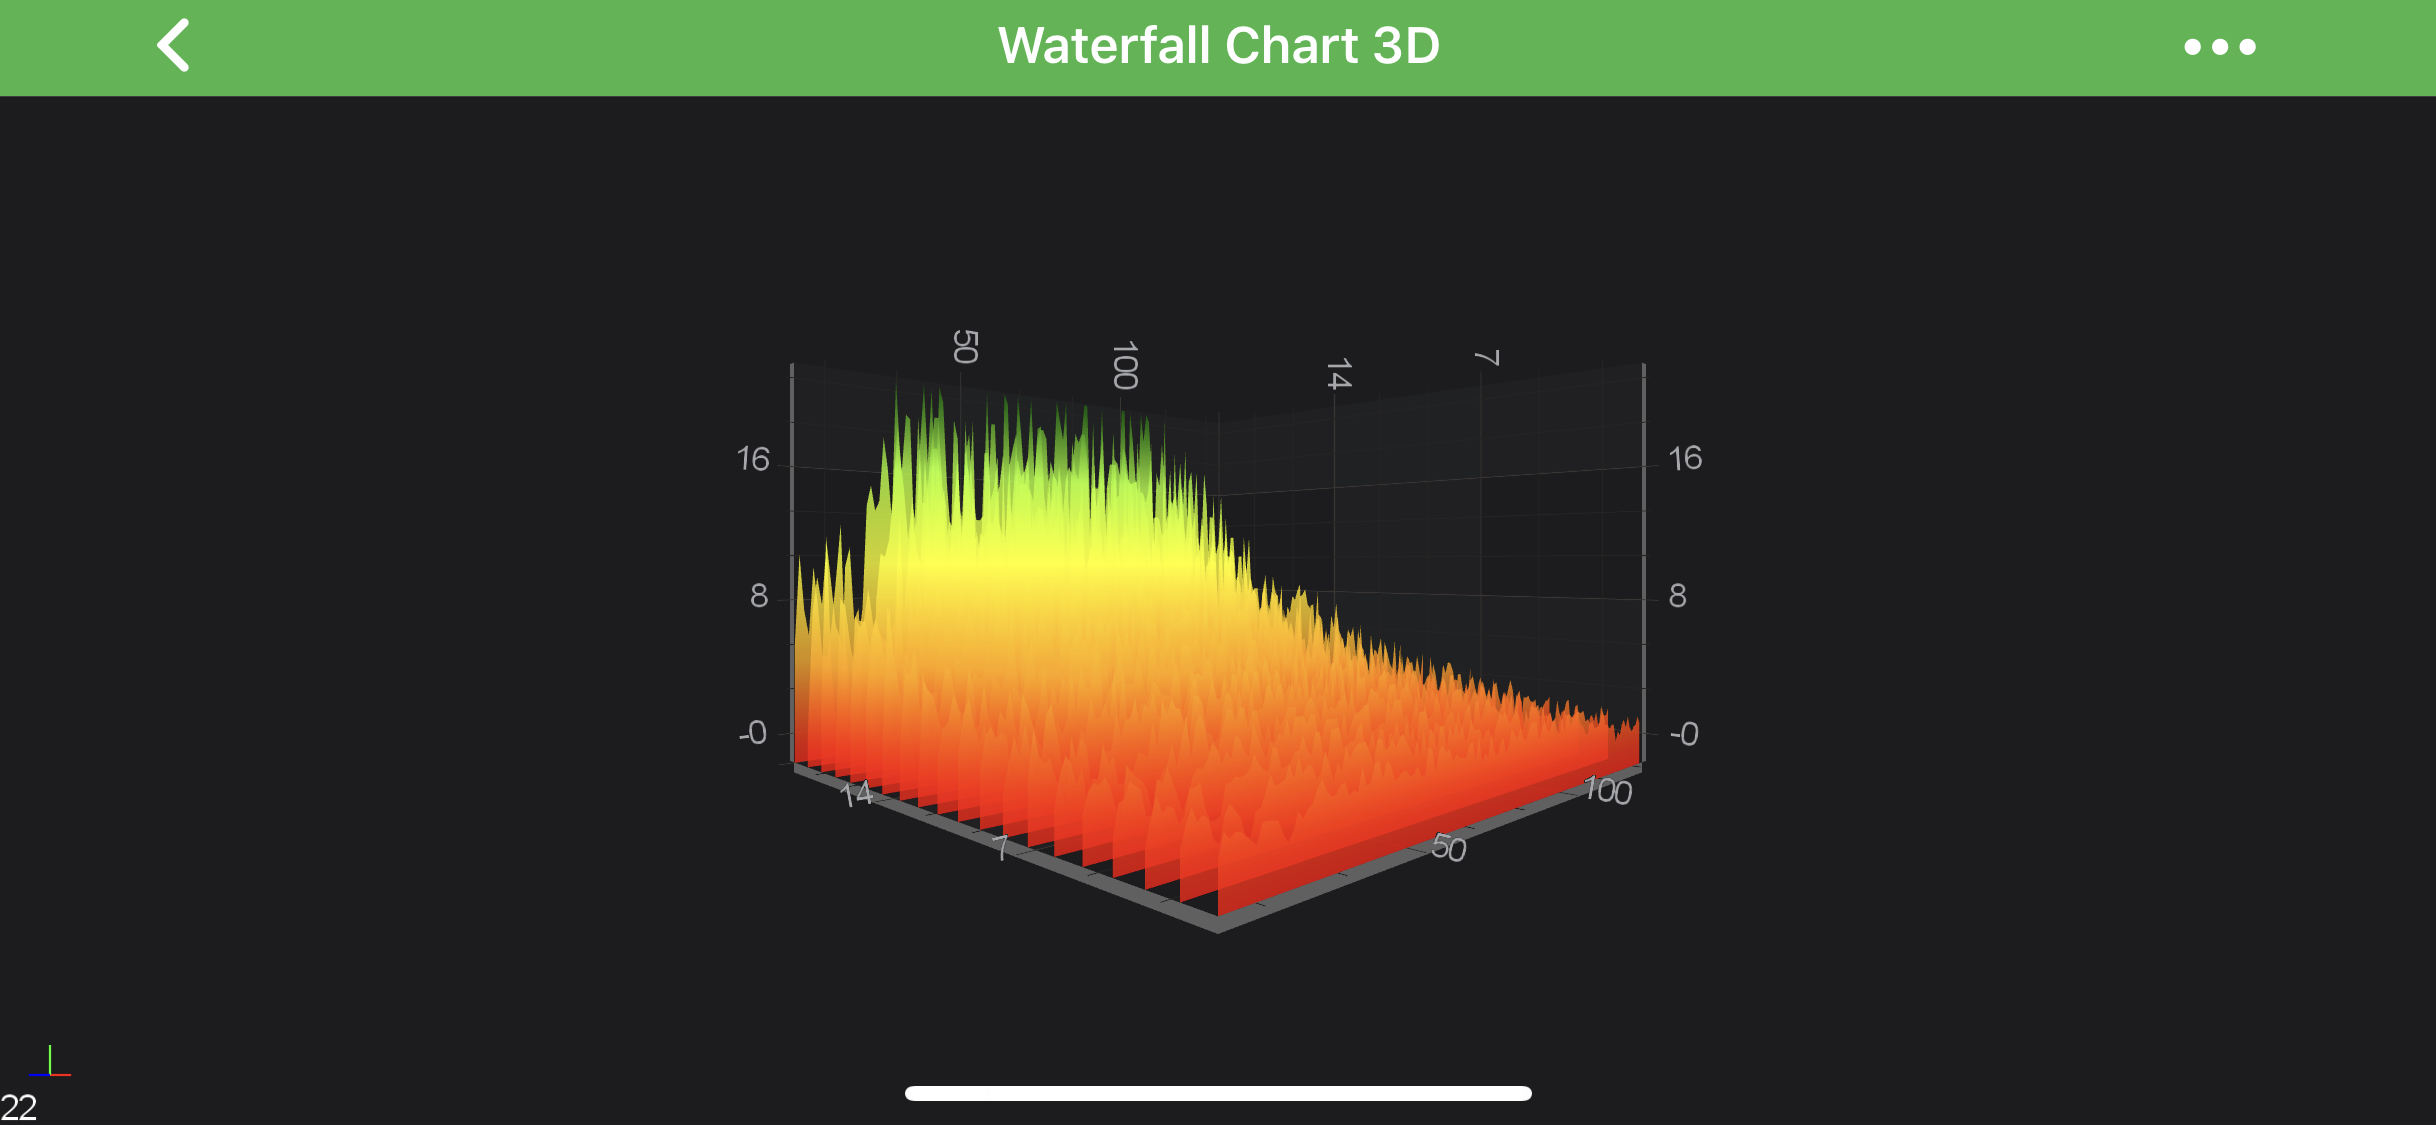
The Waterfall 3D Chart Type
The Waterfall Chart renders a two-dimensional array as a series of slices.
In SciChart it’s defined by the SCIWaterfallRenderableSeries3D
dynamic updating slices for visualizing spectra (Acoustic or radio frequency domain data)volumetric slicesoptional PointMarkers at data-points.
and more…
NOTE: Waterfall 3D SciChart iOS Examples Suite as well as on GitHub :
In the Surface Mesh 3D Series, the data is stored in the SCIWaterfallDataSeries3D 2-dimensional grid double.
Some important points which is must to know while configuring the Waterfall Series :
Read on to learn more about Applying Palettes to the Waterfall
Create a Surface Mesh Series 3D
In order to create Waterfall Series - you will need to provide the SCIWaterfallDataSeries3D N x M array of points, which is an array of slices.
See the code below, which shows how to create the above chart:
OBJECTIVE-C
SWIFT
XAMARIN
const int PointsPerSlice = 128;
const int SliceCount = 20;
SCIWaterfallDataSeries3D *ds = [[SCIWaterfallDataSeries3D alloc] initWithXType:SCIDataType_Double yType:SCIDataType_Double zType:SCIDataType_Double xSize:PointsPerSlice zSize:SliceCount];
ds.startX = @(10.0);
ds.startZ = @(1.0);
[self fill:ds];
unsigned int fillColors[5] = { 0xFFFF0000, 0xFFFFA500, 0xFFFFFF00, 0xFFADFF2F, 0xFF006400 };
float fillStops[5] = { 0.0, 0.25, 0.5, 0.75, 1.0 };
SCIGradientColorPalette *fillColorPalette = [[SCIGradientColorPalette alloc] initWithColors:fillColors stops:fillStops count:5];
unsigned int strokeColors[4] = { 0xFFDC143C, 0xFFFF8C00, 0xFF32CD32, 0xFF32CD32 };
float strokeStops[4] = { 0.0, 0.3, 0.67, 1.0 };
SCIGradientColorPalette *strokeColorPalette = [[SCIGradientColorPalette alloc] initWithColors:strokeColors stops:strokeStops count:4];
SCIWaterfallRenderableSeries3D *rs = [SCIWaterfallRenderableSeries3D new];
rs.dataSeries = ds;
rs.stroke = 0xFF0000FF;
rs.strokeThickness = 1.0;
rs.sliceThickness = 0.0;
rs.yColorMapping = fillColorPalette;
rs.yStrokeColorMapping = strokeColorPalette;
rs.opacity = 0.8;
let PointsPerSlice = 128;
let SliceCount = 20;
private let fillColorPalette = SCIGradientColorPalette(colors: [0xFFFF0000, 0xFFFFA500, 0xFFFFFF00, 0xFFADFF2F, 0xFF006400], stops: [0.0, 0.25, 0.5, 0.75, 1.0], count: 5)
private let strokeColorPalette = SCIGradientColorPalette(colors: [0xFFDC143C, 0xFFFF8C00, 0xFF32CD32, 0xFF32CD32], stops: [0.0, 0.33, 0.67, 1.0], count: 4)
let ds = SCIWaterfallDataSeries3D(xType: .double, yType: .double, zType: .double, xSize: PointsPerSlice, zSize: SliceCount)
ds.set(startX: 10.0)
ds.set(startZ: 1.0)
fill(dataSeries: ds)
let rs = SCIWaterfallRenderableSeries3D()
rs.dataSeries = ds
rs.stroke = 0xFF0000FF
rs.strokeThickness = 1.0
rs.sliceThickness = 0.0
rs.yColorMapping = fillColorPalette
rs.yStrokeColorMapping = strokeColorPalette
rs.opacity = 0.8;
var dataSeries3D = new WaterfallDataSeries3D<double, double, double>(pointsPerSlice, sliceCount) { StartX = 10d, StepX = 1d, StartZ = 1d };
for (int i = 0; i < sliceCount; i++)
{
dataSeries3D.SetRowAt(i, data[i]);
}
var rSeries3D = new SCIWaterfallRenderableSeries3D
{
DataSeries = dataSeries3D,
StrokeThickness = 1f,
SliceThickness = 0f,
YColorMapping = new SCIGradientColorPalette(
new[] { ColorUtil.Red, ColorUtil.Orange, ColorUtil.Yellow, ColorUtil.GreenYellow, ColorUtil.DarkGreen },
new[] { 0, .25f, .5f, .75f, 1 }),
YStrokeColorMapping = new SCIGradientColorPalette(
new[] { ColorUtil.Crimson, ColorUtil.DarkOrange, ColorUtil.LimeGreen, ColorUtil.LimeGreen },
new[] { 0, 0.33f, 0.67f, 1 }),
Opacity = 0.8f,
};
Applying Palettes to the Waterfall
The Waterfall 3D SurfaceMesh Chart .
To learn more about the types of palette available and how to declare them - please see the Applying Palettes section of the 3D SurfaceMesh Chart article.
Palettes which may be applied to the SCIWaterfallRenderableSeries3D
The properties which allow colouring the Waterfall slices and outlines are available for the Z-Direction and Y-Direction.
Those are mutually exclusive, and you should choose one direction at a time.
Read on to see some examples of applying Palettes to SCIWaterfallRenderableSeries3D
Applying Solid Palettes to Waterfall Slices
To apply Solid color to the Waterfall Slices, please use the following code:
OBJECTIVE-C
SWIFT
XAMARIN
rSeries.yColorMapping = [[SCISolidColorBrushPalette alloc] initWithColor:0xFF6495ED];
rSeries.yStrokeColorMapping = [[SCISolidColorBrushPalette alloc] initWithColor:0xFF6495ED];
rSeries.yColorMapping = SCISolidColorBrushPalette(color: 0xFF6495ED)
rSeries.yStrokeColorMapping = SCISolidColorBrushPalette(color: 0xFF6495ED)
rSeries.YColorMapping = new SCISolidColorBrushPalette(0xFF6495ED);
rSeries.YStrokeColorMapping = new SCISolidColorBrushPalette(0xFF6495ED);
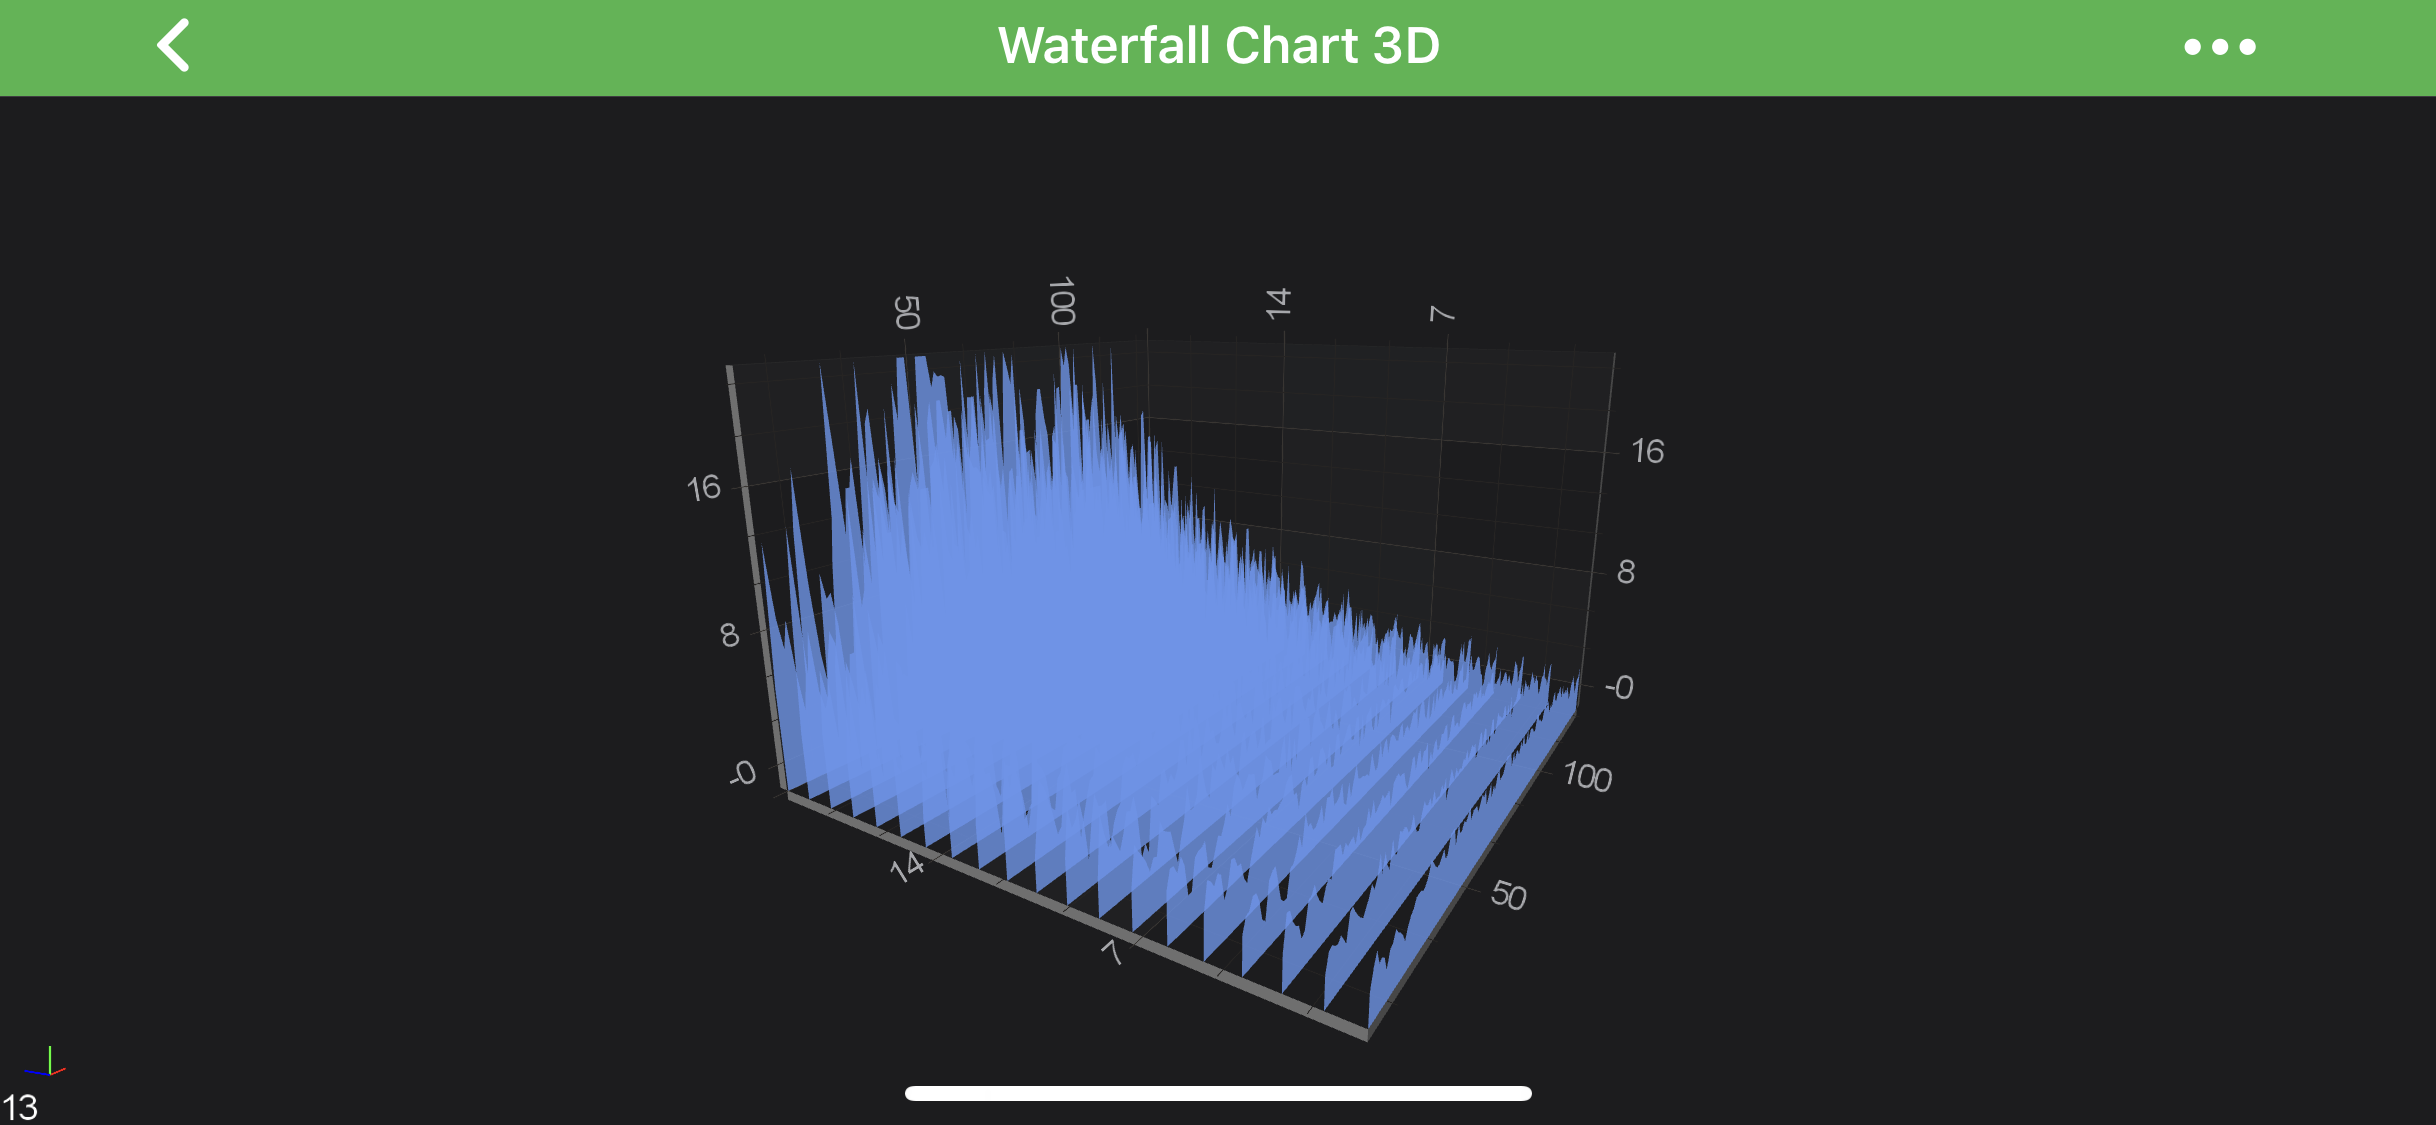
Solid Fill Solid Outline
Applying Linear Gradient Palettes to Waterfall Slice Fill
To apply Linear Gradient to the Waterfall Slices, first prepare the SCIGradientColorPalette for the upcoming steps:
OBJECTIVE-C
SWIFT
XAMARIN
unsigned int colors[5] = { 0xFFFF0000, 0xFFFFA500, 0xFFFFFF00, 0xFFADFF2F, 0xFF006400 };
float stops[5] = { 0.0, 0.25, 0.5, 0.75, 1.0 };
SCIGradientColorPalette *colorPalette = [[SCIGradientColorPalette alloc] initWithColors:colors stops:stops count:5];
let colorPalette = SCIGradientColorPalette(colors: [0xFFFF0000, 0xFFFFA500, 0xFFFFFF00, 0xFFADFF2F, 0xFF006400], stops: [0.0, 0.25, 0.5, 0.75, 1.0], count: 5)
var colorPalette = new SCIGradientColorPalette(
new[] { ColorUtil.Red, ColorUtil.Orange, ColorUtil.Yellow, ColorUtil.GreenYellow, ColorUtil.DarkGreen },
new[] { 0, .25f, .5f, .75f, 1 });
From here, we can apply it to the Slice Fill Outline Both
Applying a Color Palette onto Slice Fill Y or Z direction:
OBJECTIVE-C
SWIFT
XAMARIN
// Z-Direction
rSeries.zColorMapping = colorPalette;
rSeries.zStrokeColorMapping = [[SCISolidColorBrushPalette alloc] initWithColor:0x00FFFFFF];
// or Y-Direction
rSeries.yColorMapping = colorPalette;
rSeries.yStrokeColorMapping = [[SCISolidColorBrushPalette alloc] initWithColor:0x00FFFFFF];
// Z-Direction
rSeries.zColorMapping = colorPalette
rSeries.zStrokeColorMapping = SCISolidColorBrushPalette(color: 0x00FFFFFF)
// or Y-Direction
rSeries.yColorMapping = colorPalette
rSeries.yStrokeColorMapping = SCISolidColorBrushPalette(color: 0x00FFFFFF)
// Z-Direction
rSeries.ZColorMapping = colorPalette;
rSeries.ZStrokeColorMapping = new SCISolidColorBrushPalette(0x00FFFFFF);
// or Y-Direction
rSeries.YColorMapping = colorPalette;
rSeries.YStrokeColorMapping = new SCISolidColorBrushPalette(0x00FFFFFF);
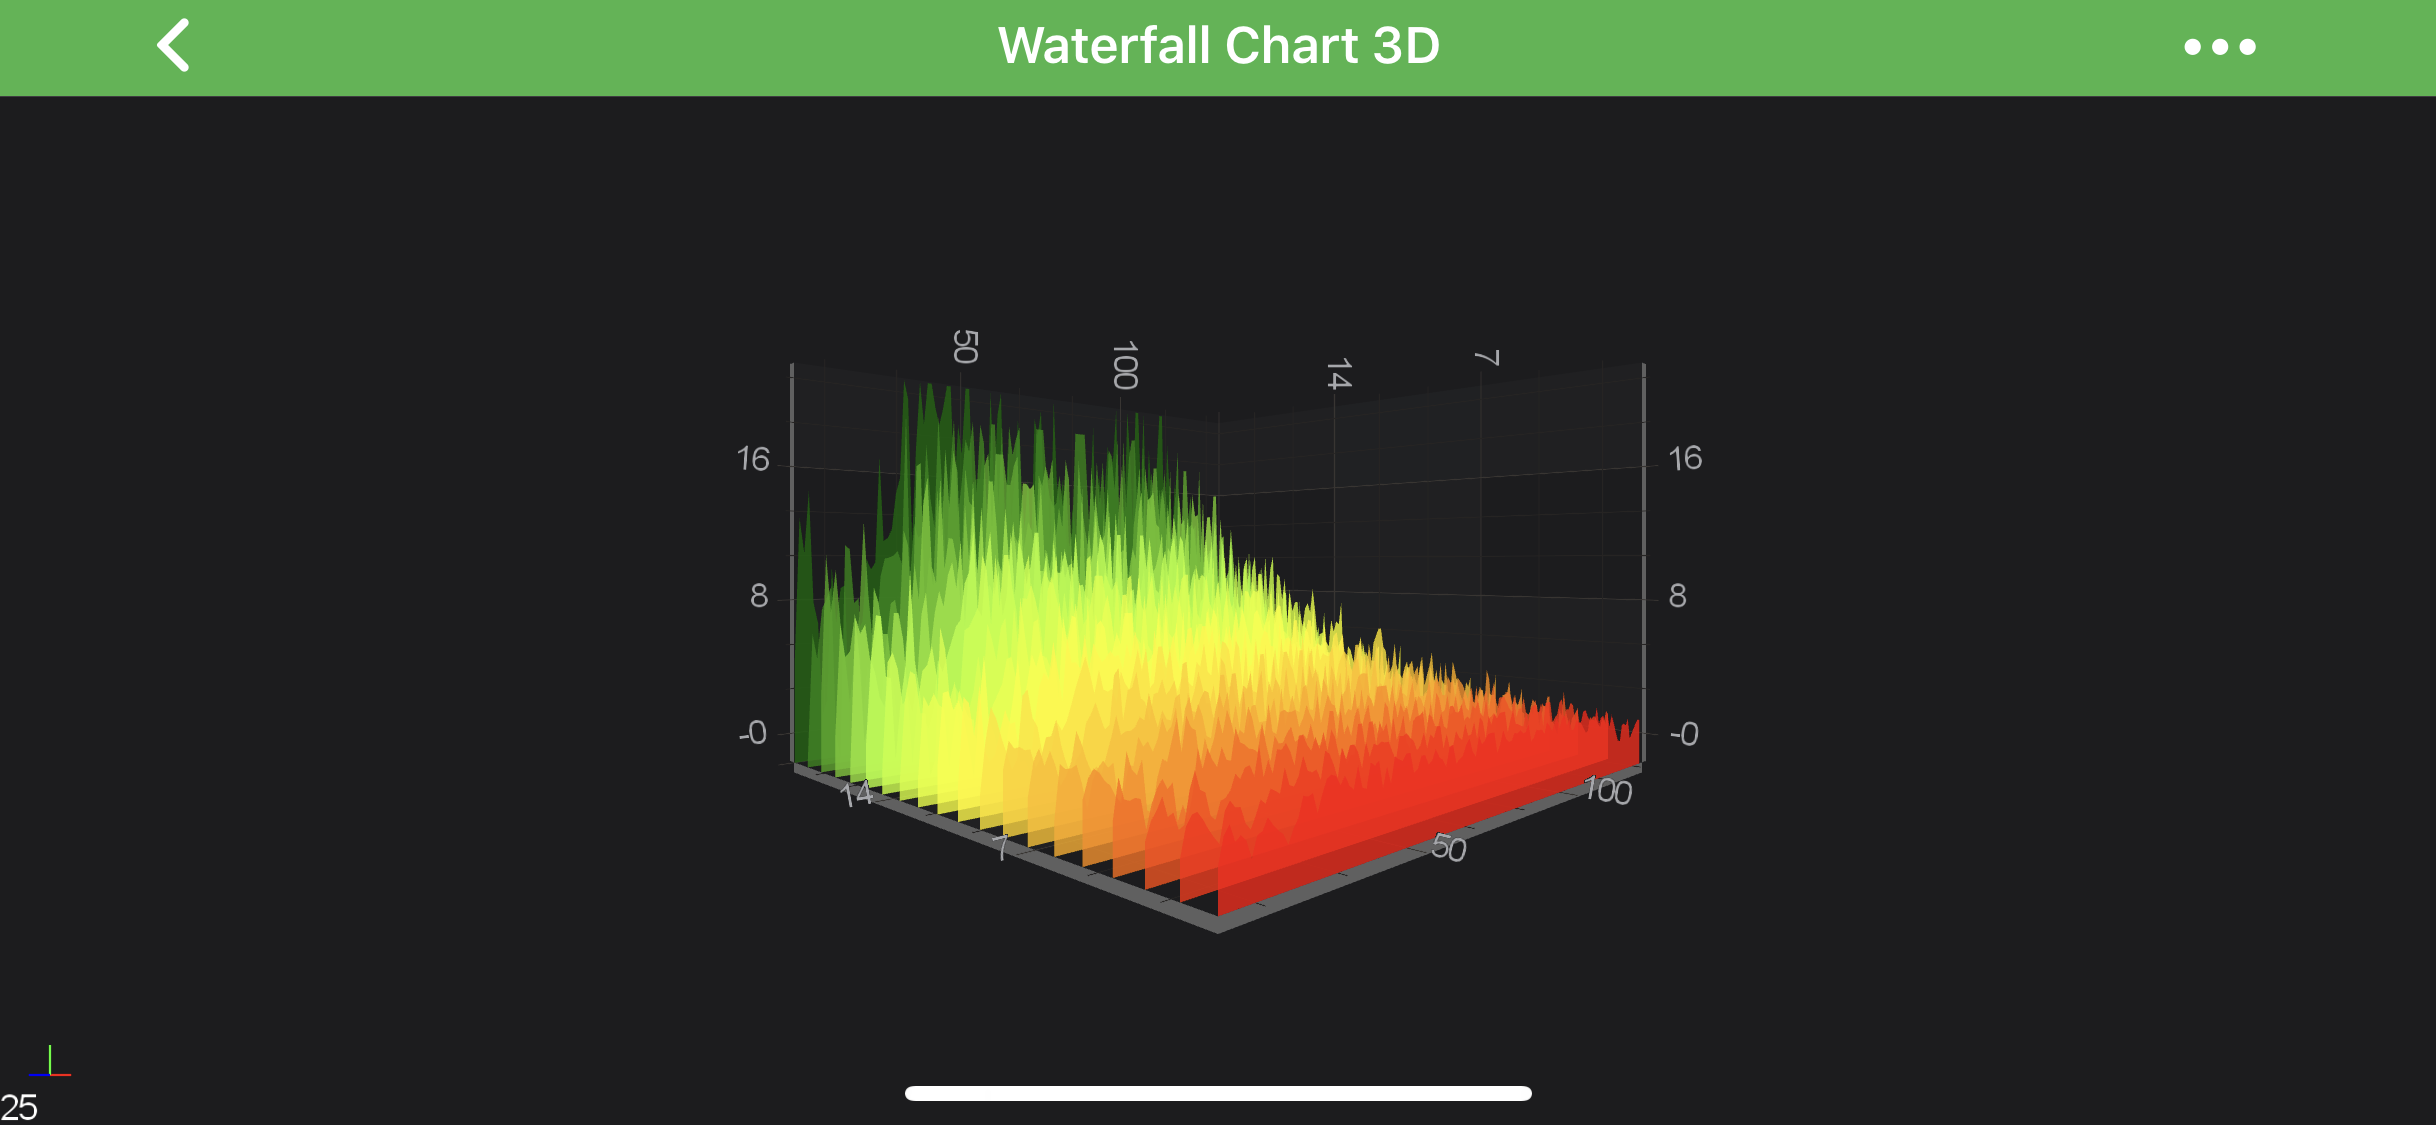
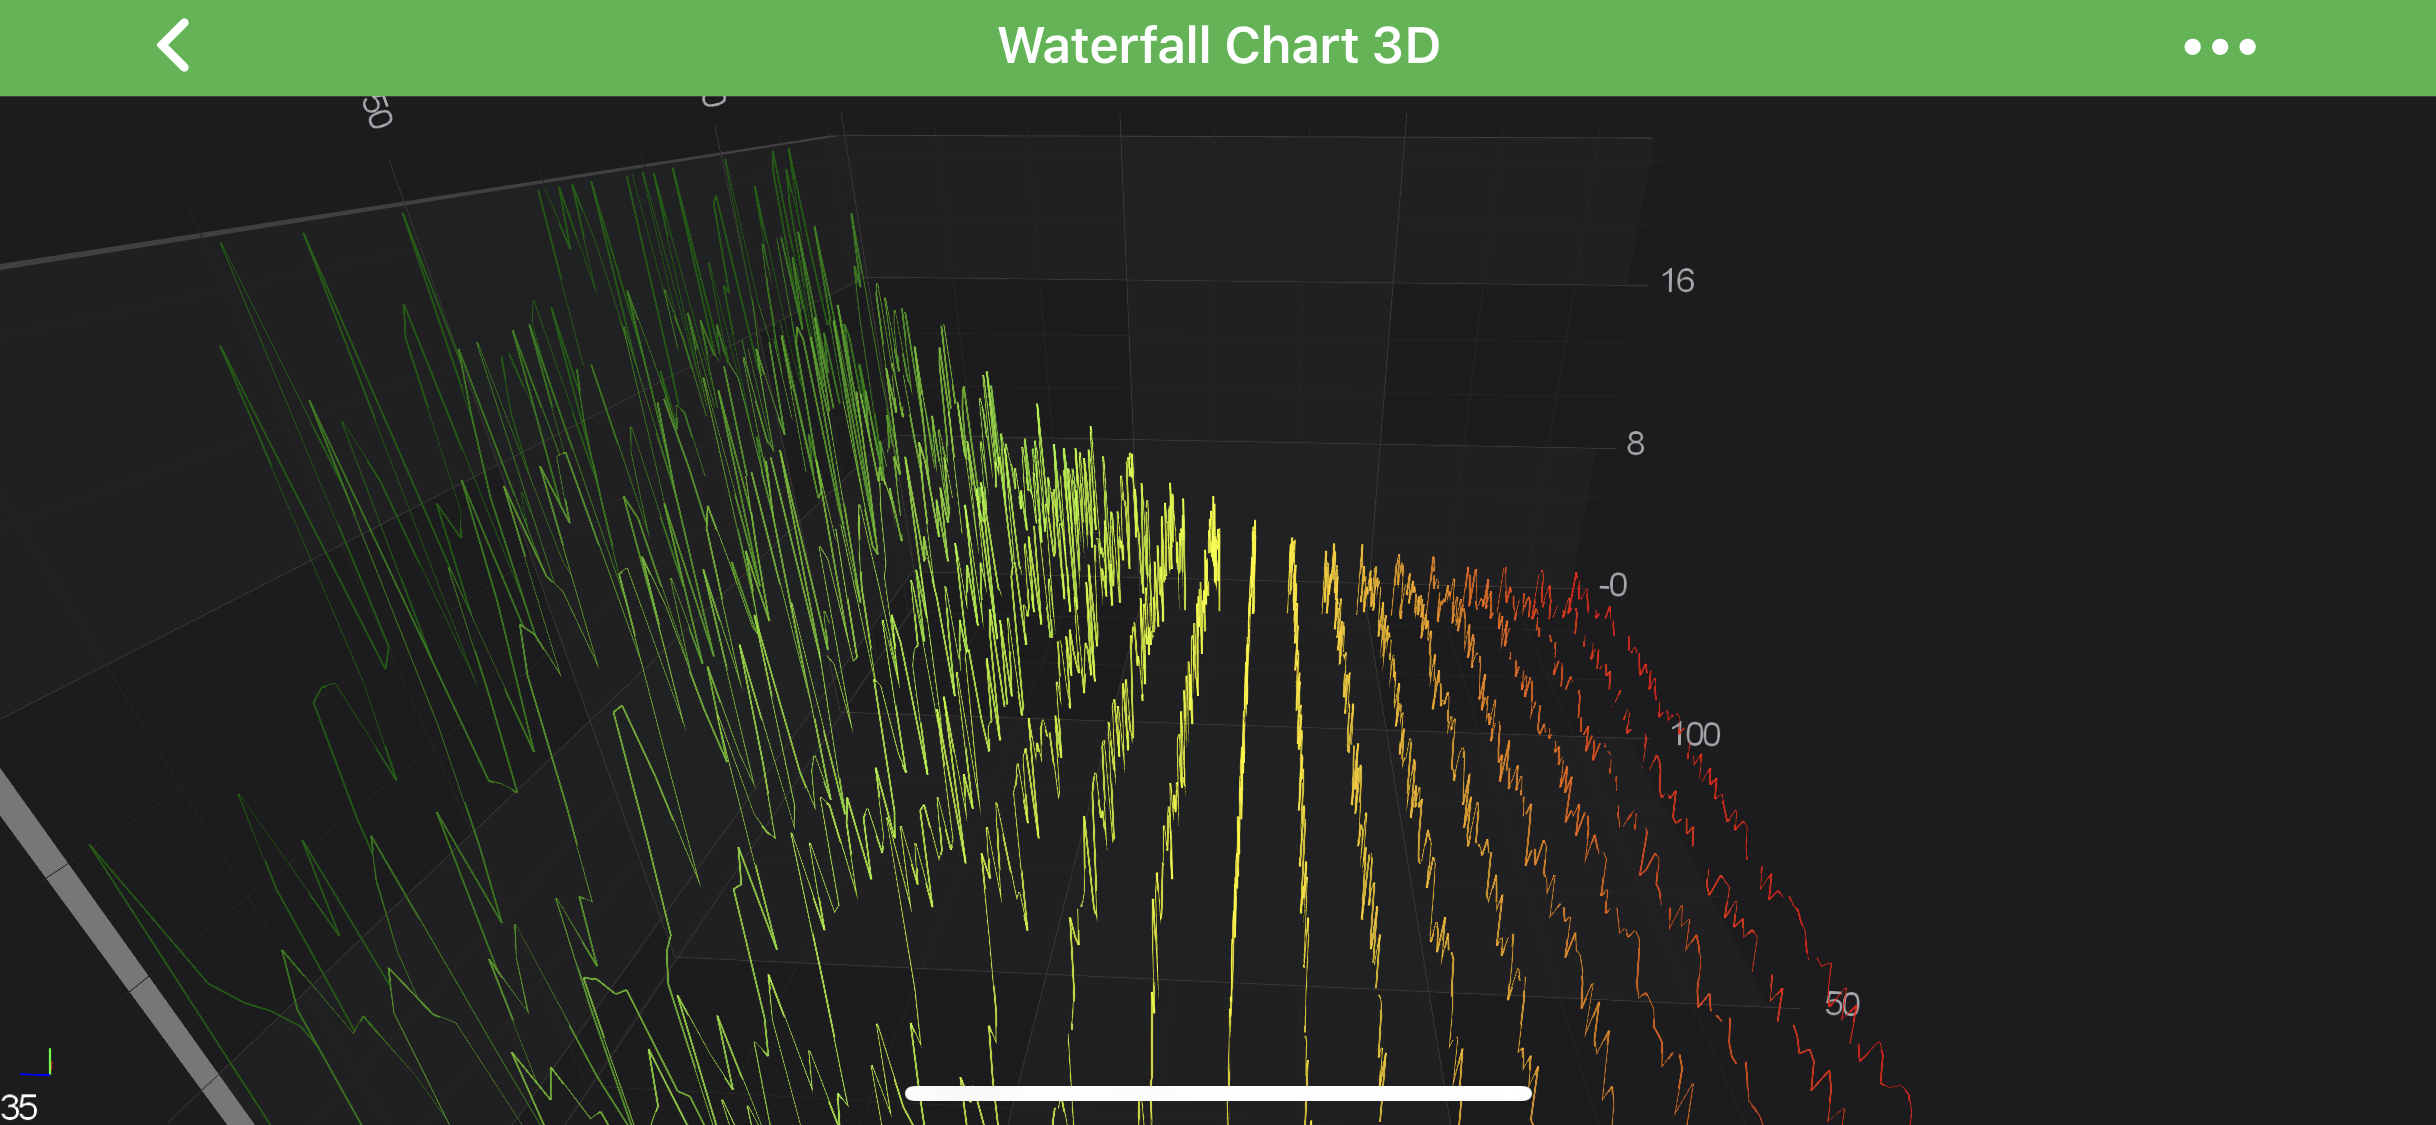
Z-Direction Fill Y-Direction Fill
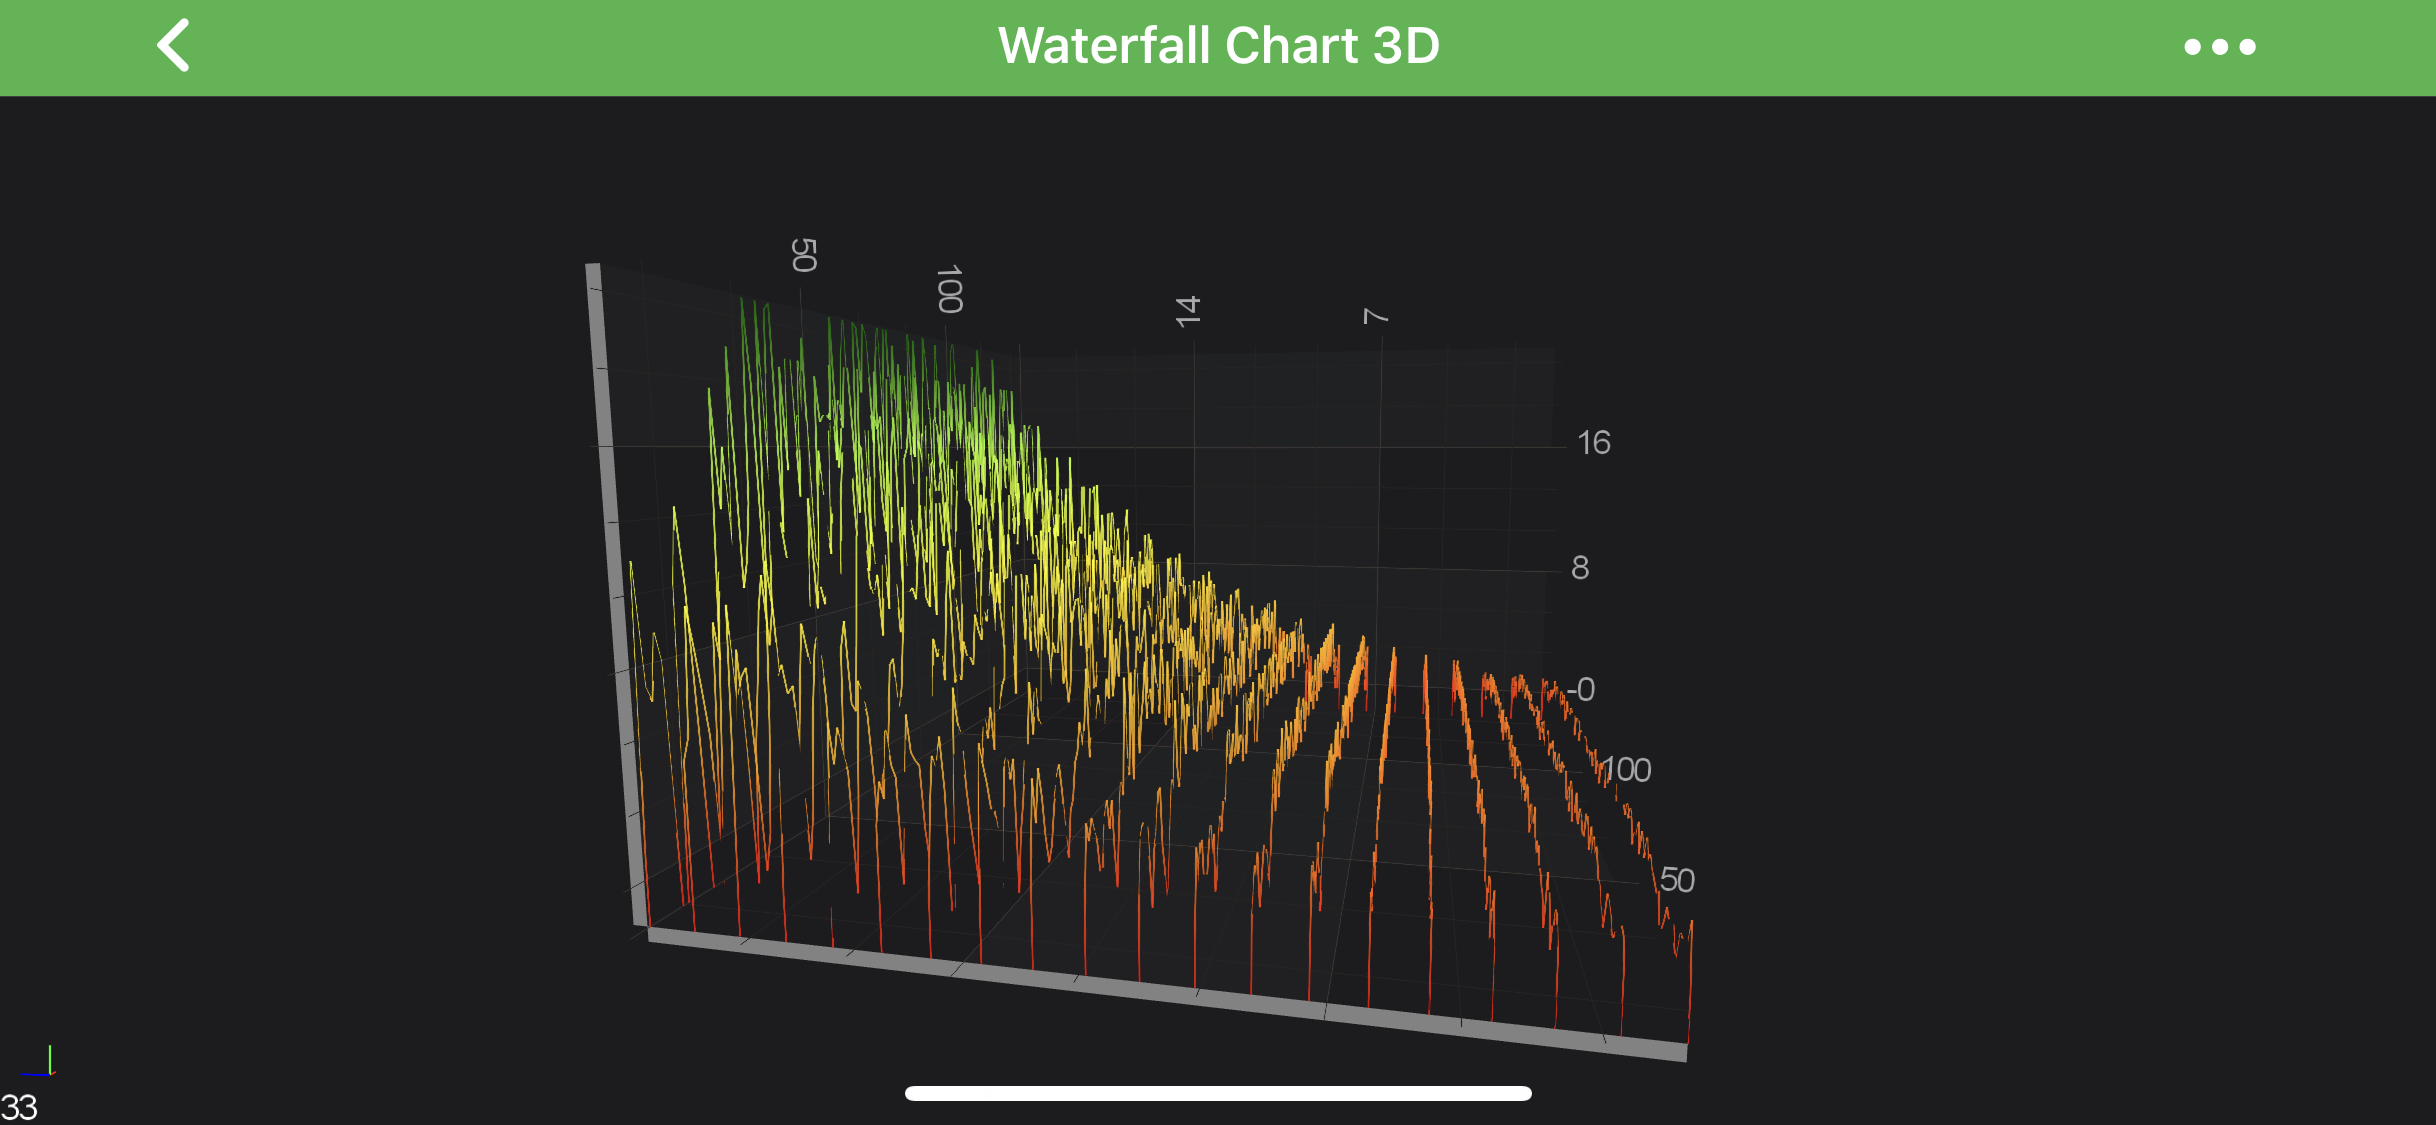
Applying a Color Palette onto Slice Stroke Y or Z direction:
OBJECTIVE-C
SWIFT
XAMARIN
// Z-Direction
rSeries.zColorMapping = [[SCISolidColorBrushPalette alloc] initWithColor:0x00FFFFFF];
rSeries.zStrokeColorMapping = colorPalette;
// or Y-Direction
rSeries.yColorMapping = [[SCISolidColorBrushPalette alloc] initWithColor:0x00FFFFFF];
rSeries.yStrokeColorMapping = colorPalette;
// Z-Direction
rSeries.zColorMapping = SCISolidColorBrushPalette(color: 0x00FFFFFF)
rSeries.zStrokeColorMapping = colorPalette
// or Y-Direction
rSeries.yColorMapping = SCISolidColorBrushPalette(color: 0x00FFFFFF)
rSeries.yStrokeColorMapping = colorPalette
// Z-Direction
rSeries.ZColorMapping = new SCISolidColorBrushPalette(0x00FFFFFF);
rSeries.ZStrokeColorMapping = colorPalette;
// or Y-Direction
rSeries.YColorMapping = new SCISolidColorBrushPalette(0x00FFFFFF);
rSeries.YStrokeColorMapping = colorPalette;
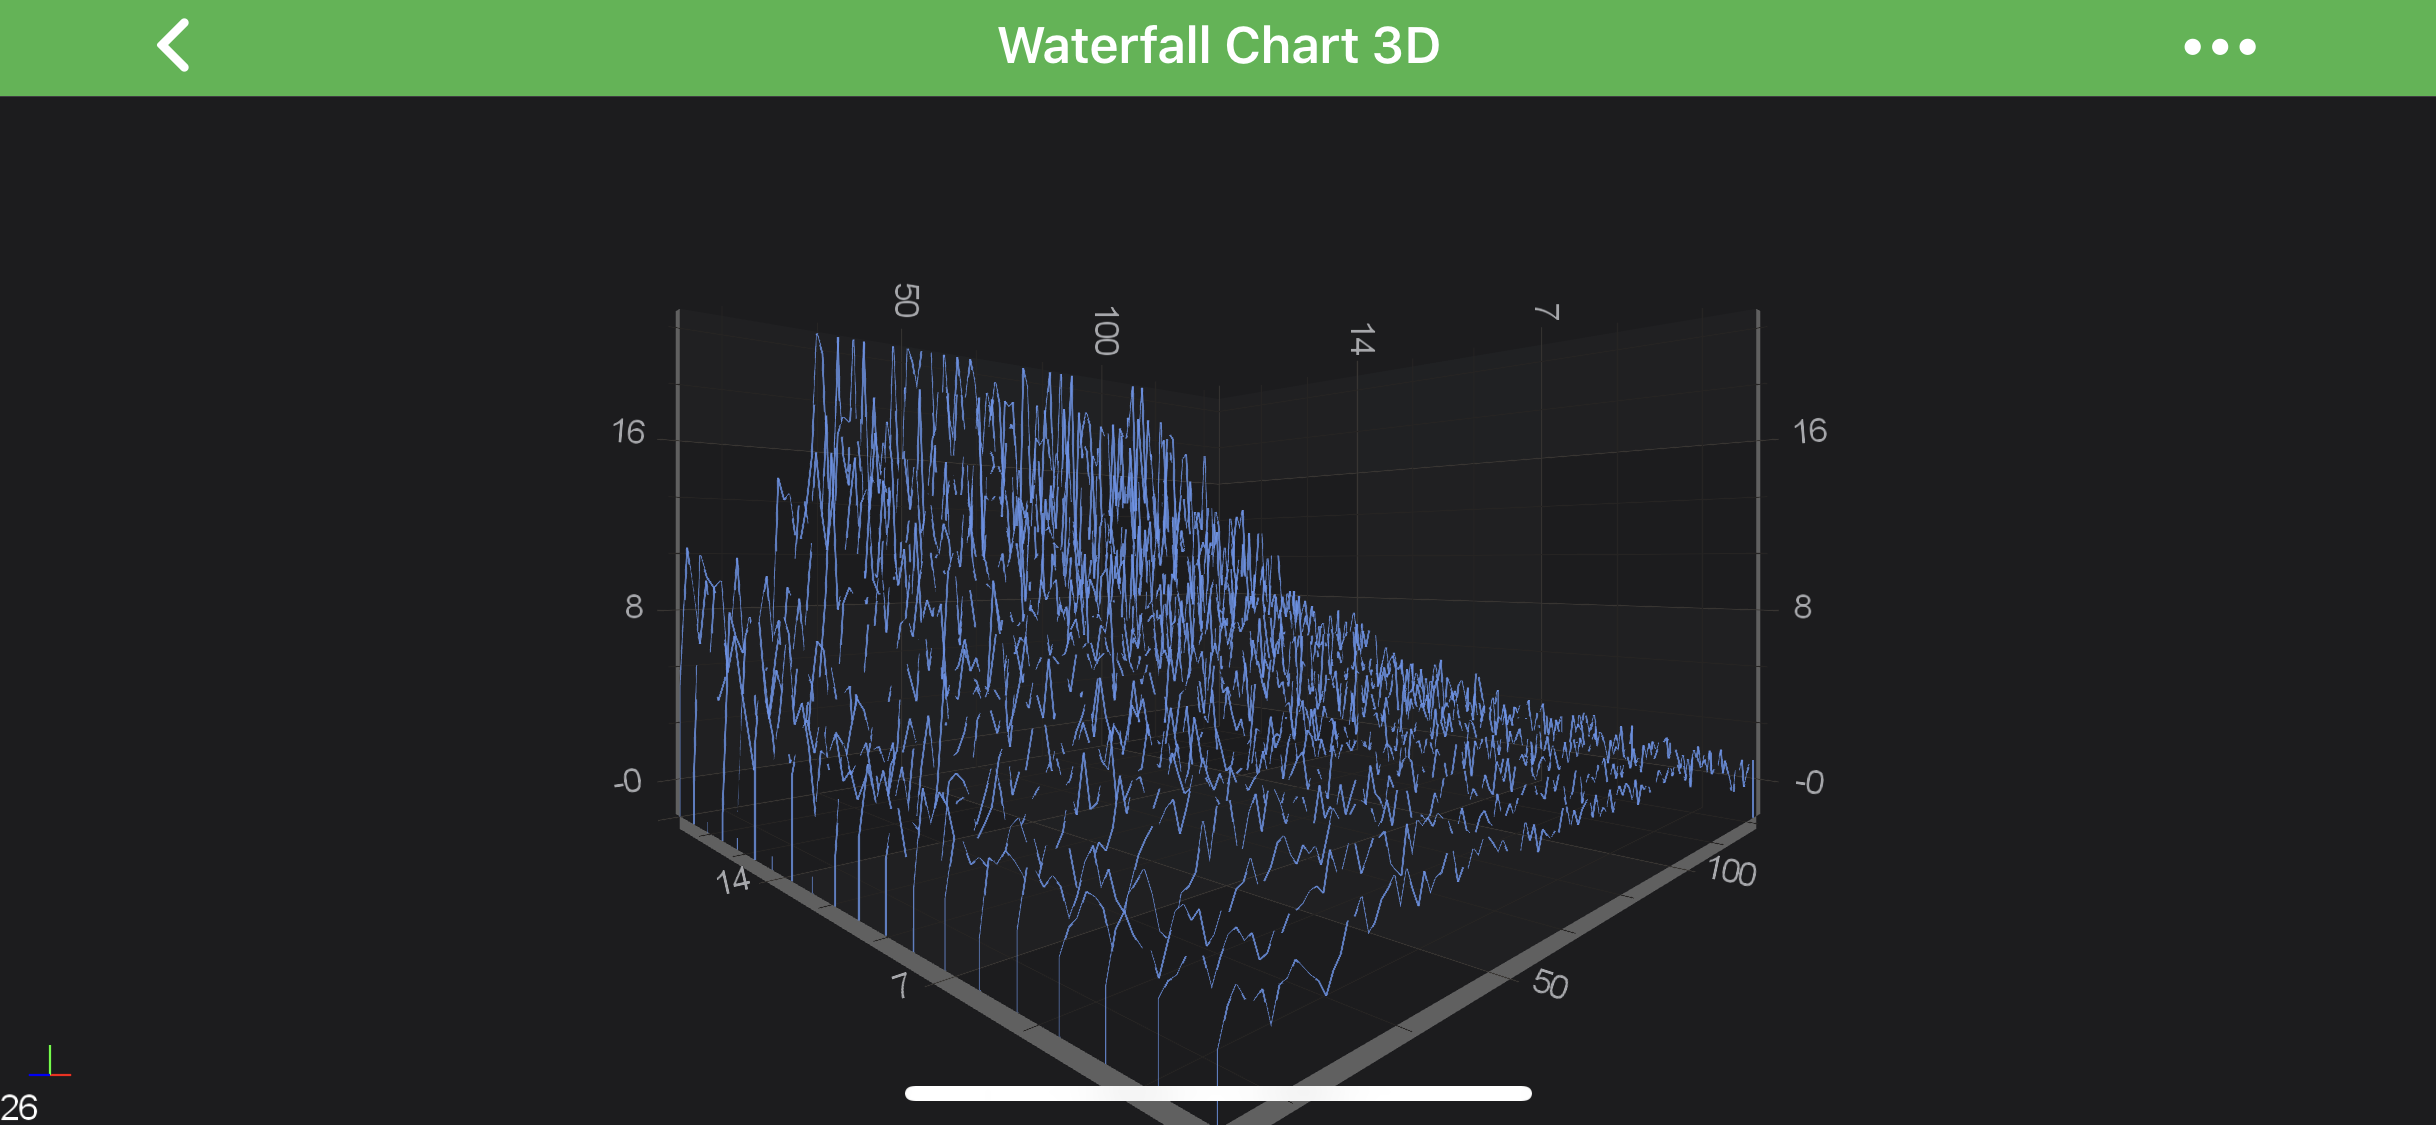
Z-Direction Stroke Y-Direction Stroke
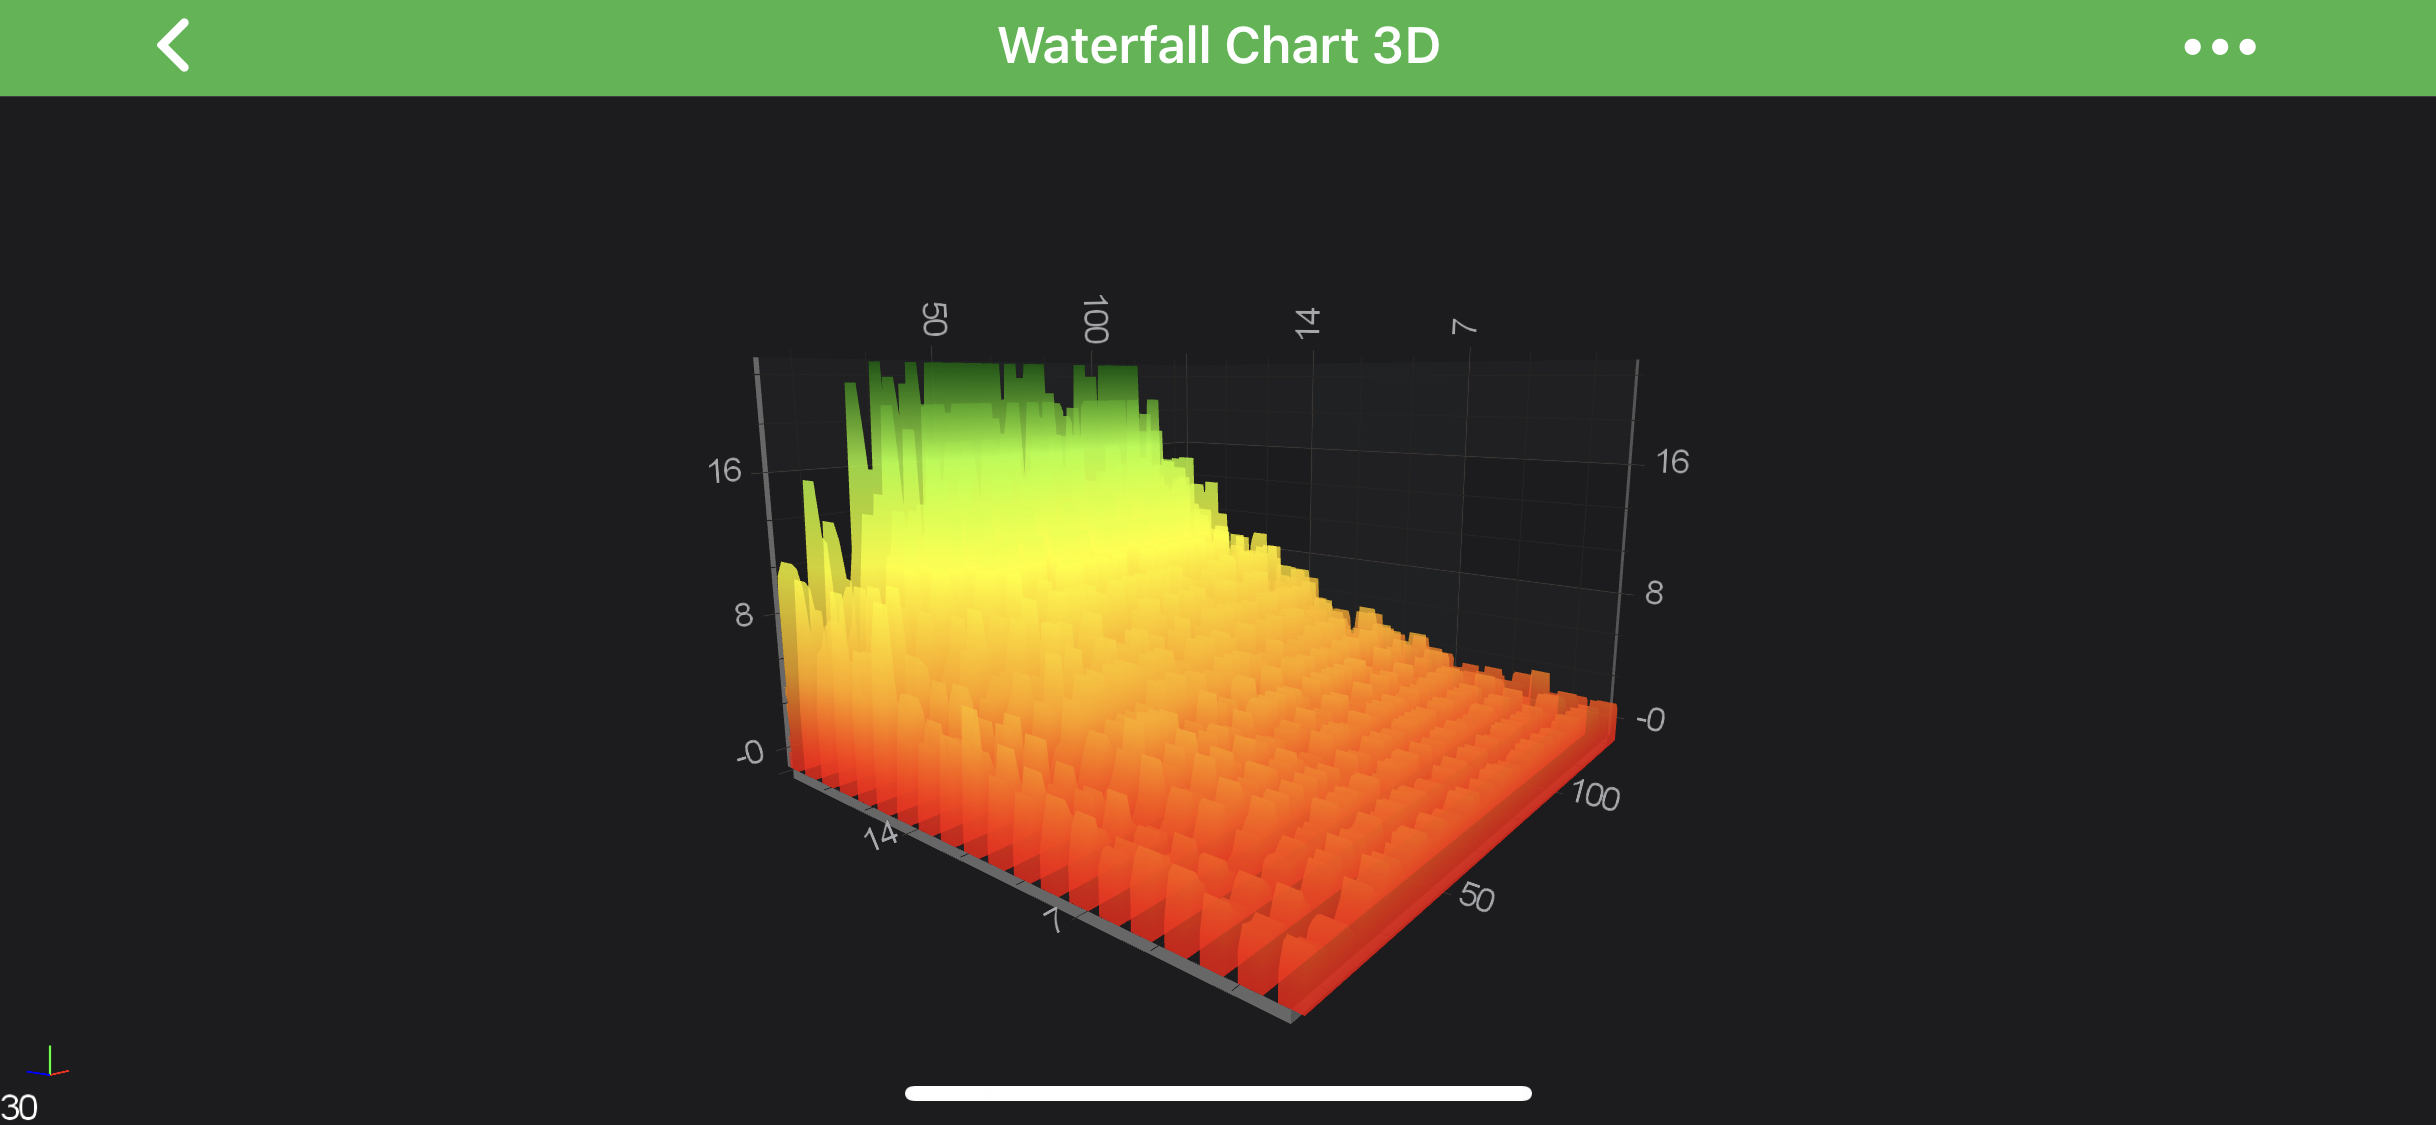
Volumetric Waterfall 3D
A Waterfall Chart can be made volumetric by setting the property SCIWaterfallRenderableSeries3D.sliceThickness
OBJECTIVE-C
SWIFT
XAMARIN
SCIWaterfallRenderableSeries3D *rSeries = [SCIWaterfallRenderableSeries3D new];
rSeries.sliceThickness = 10.0;
let rSeries = SCIWaterfallRenderableSeries3D()
rSeries.sliceThickness = 10.0
var rSeries = new SCIWaterfallRenderableSeries3D();
rSeries.SliceThickness = 10.0;
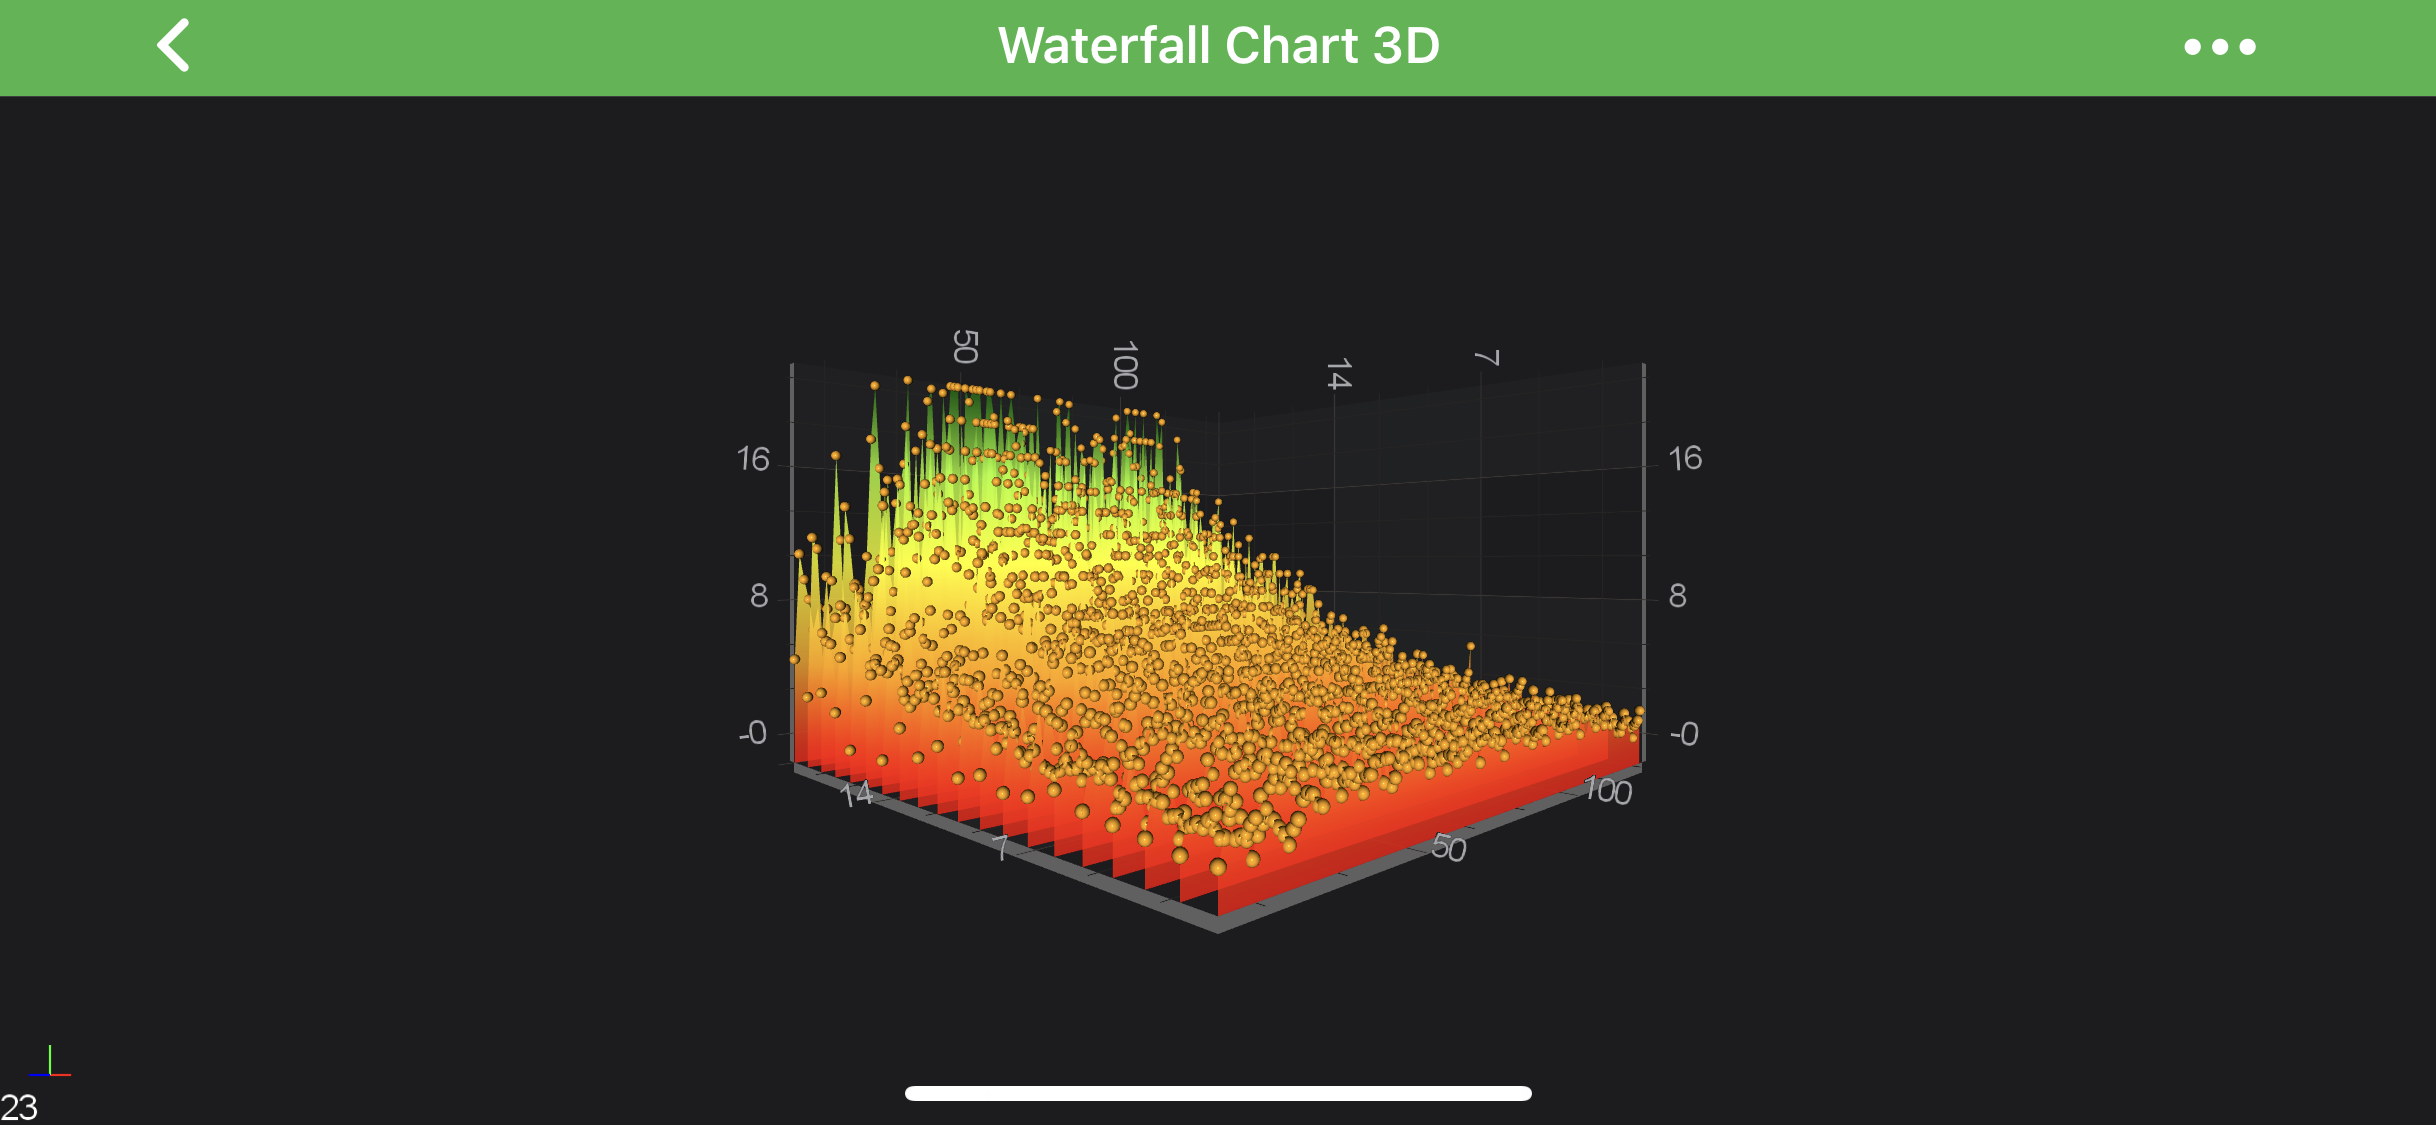
PointMarkers on Waterfall 3D
A Waterfall Chart Slice data-points can be marked with a Point Markers .
That’s achieved by providing the Point Marker 3D for the SCIWaterfallRenderableSeries3D
OBJECTIVE-C
SWIFT
XAMARIN
SCISpherePointMarker3D *pointMarker = [SCISpherePointMarker3D new];
pointMarker.fillColor = 0xFFFFA500;
pointMarker.size = 10.0;
SCIWaterfallRenderableSeries3D *rSeries = [SCIWaterfallRenderableSeries3D new];
rSeries.pointMarker = pointMarker;
let pointMarker = SCISpherePointMarker3D()
pointMarker.fillColor = 0xFFFFA500;
pointMarker.size = 10.0
let rSeries = SCIWaterfallRenderableSeries3D()
rSeries.pointMarker = pointMarker
var rSeries = new SCIWaterfallRenderableSeries3D();
rSeries.PointMarker = new SCISpherePointMarker3D { FillColor = 0xFFFFA500, Size = 10.0f };
NOTE: PointMarker API article.
Real-time Waterfall 3D Example
In SciChart, it’s possible to create real-time Waterfall 3D Charts which is shown below:
NOTE: Real-Time Waterfall 3D SciChart iOS Examples Suite as well as on GitHub :
 View on GitHub