NOTE: This tutorial assumes that you’ve already know how to Link SciChart iOS and Add SCIChartSurface instance into your ViewController. If you need more information - please read the following articles:
Once you have added a SCIChartSurface into your ViewController, you will not see anything drawn because you need to add axes.
This is important thing here - two axes X and Y has to be added to your surface. This is a bare minimum to see drawn grid on your device.
Now, we would like to see something more than just empty grid, e.g. Some Scatter Chart or a Line Chart.
To draw some data in chart we need to create 3D DataSeries and RenderableSeries.
The DataSeries is a class which is responsible for storing data which should be displayed.
For more information about the DataSeries types available in SciChart - refer to the DataSeries Types article.
The RenderableSeries on the other hand are the special classes in SciChart, that determines how data should be visualized by chart.
You can find more information about RenderableSeries in the 2D Chart Types.
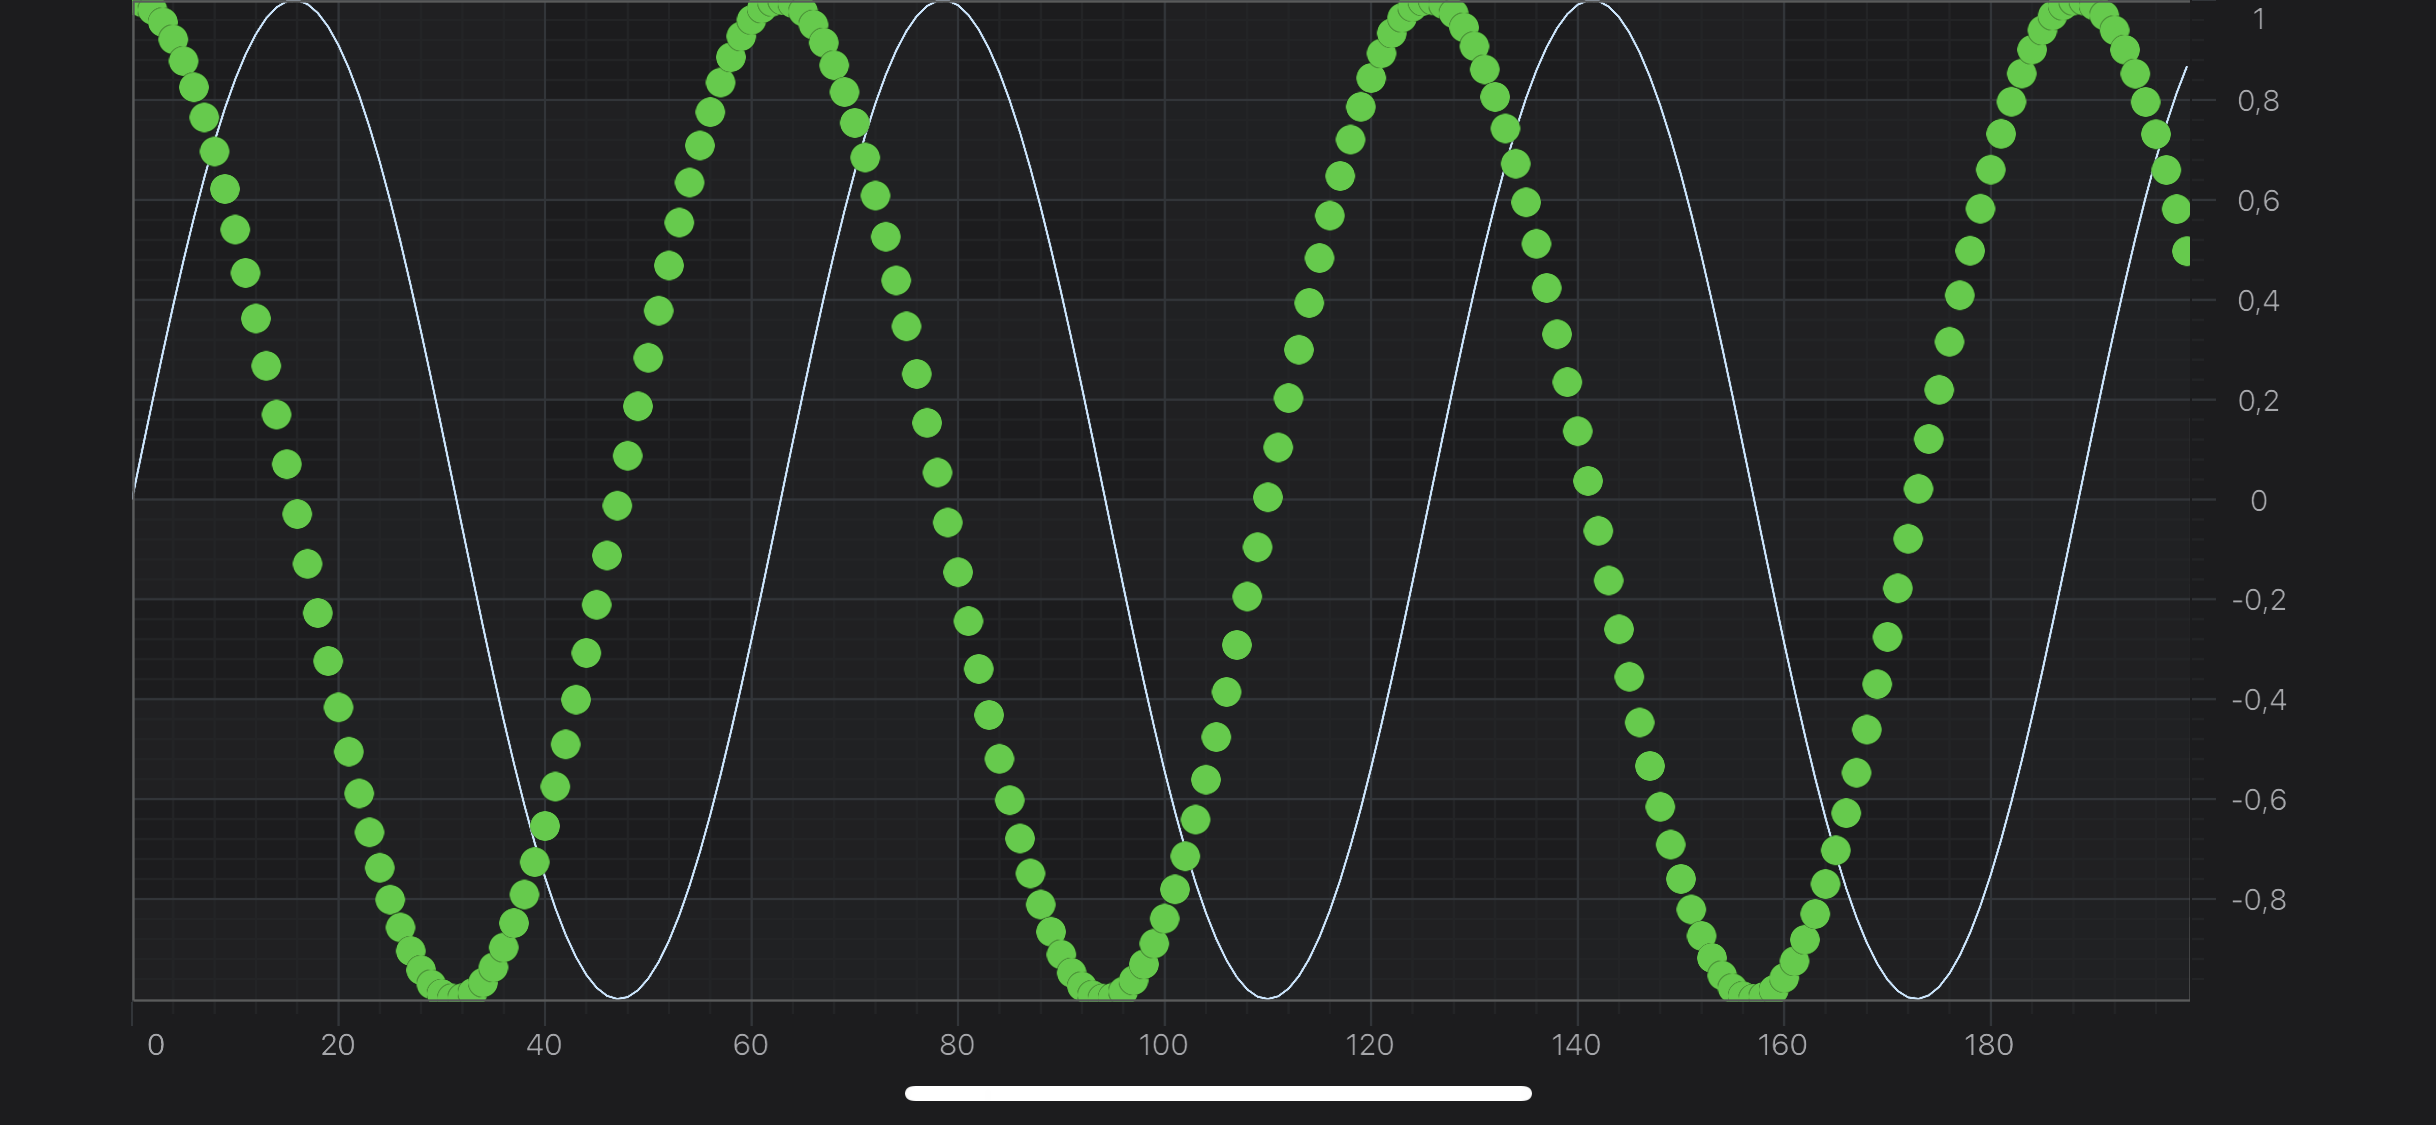
In this tutorial, we are going to add a Line and a Scatter series onto the chart.
First, let’s declare the DataSeries for both and generate some data for them below:
let lineDataSeries = SCIXyDataSeries(xType: .int, yType: .double)
let scatterDataSeries = SCIXyDataSeries(xType: .int, yType: .double)
for i in 0 ..< 200 {
lineDataSeries.append(x: i, y: sin(Double(i) * 0.1))
scatterDataSeries.append(x: i, y: cos(Double(i) * 0.1))
}
var lineDataSeries = new XyDataSeries<int, double>();
var scatterDataSeries = new XyDataSeries<int, double>();
for (int i = 0; i < 200; i++)
{
lineDataSeries.Append(i, Math.Sin(i * 0.1));
scatterDataSeries.Append(i, Math.Cos(i * 0.1));
}
The next step is to create Line and ScatterRenderableSeries and provide previously created DataSeries to it.
Please note, that Scatter Series requires a PointMarker to be drawn.
var lineSeries = new SCIFastLineRenderableSeries { DataSeries = lineDataSeries };
var scatterSeries = new SCIXyScatterRenderableSeries
{
DataSeries = scatterDataSeries,
PointMarker = new SCIEllipsePointMarker { FillStyle = new SCISolidBrushStyle(0xFF32CD32), Size = new CGSize(10, 10) }
};
using (Surface.SuspendUpdates())
{
Surface.XAxes.Add(new SCINumericAxis());
Surface.YAxes.Add(new SCINumericAxis());
Surface.RenderableSeries.Add(lineSeries);
Surface.RenderableSeries.Add(scatterSeries);
}
Which will render the following Chart:
NOTE: Please note that we’ve added axes and renderableSeries to SCIChartSurface inside +[SCIUpdateSuspender usingWithSuspendable:withBlock:] block. This allows to suspend surface instance and refresh it only one time after you finished all needed operations. That’s highly recommended technique, if you want to omit performance decrease due to triggering refreshes on every operation which could be performed in one batch.
Where to Go From Here?
You can download the final project from our GitHub Repository:
Of course, this is not the limit of what you can achieve with the SciChart iOS.
Our documentation contains lots of useful information, some of the articles you might want to read are listed below:
Finally, start exploring. The SciChart iOS library and functionality is quite extensive.
You can look into our SciChart iOS Examples Suite which are full of 2D and 3D examples, which are also available on our GitHub
 View on GitHub