iOS & macOS Charting Documentation - SciChart iOS & macOS Charts SDK v4.x
SCIRolloverModifier
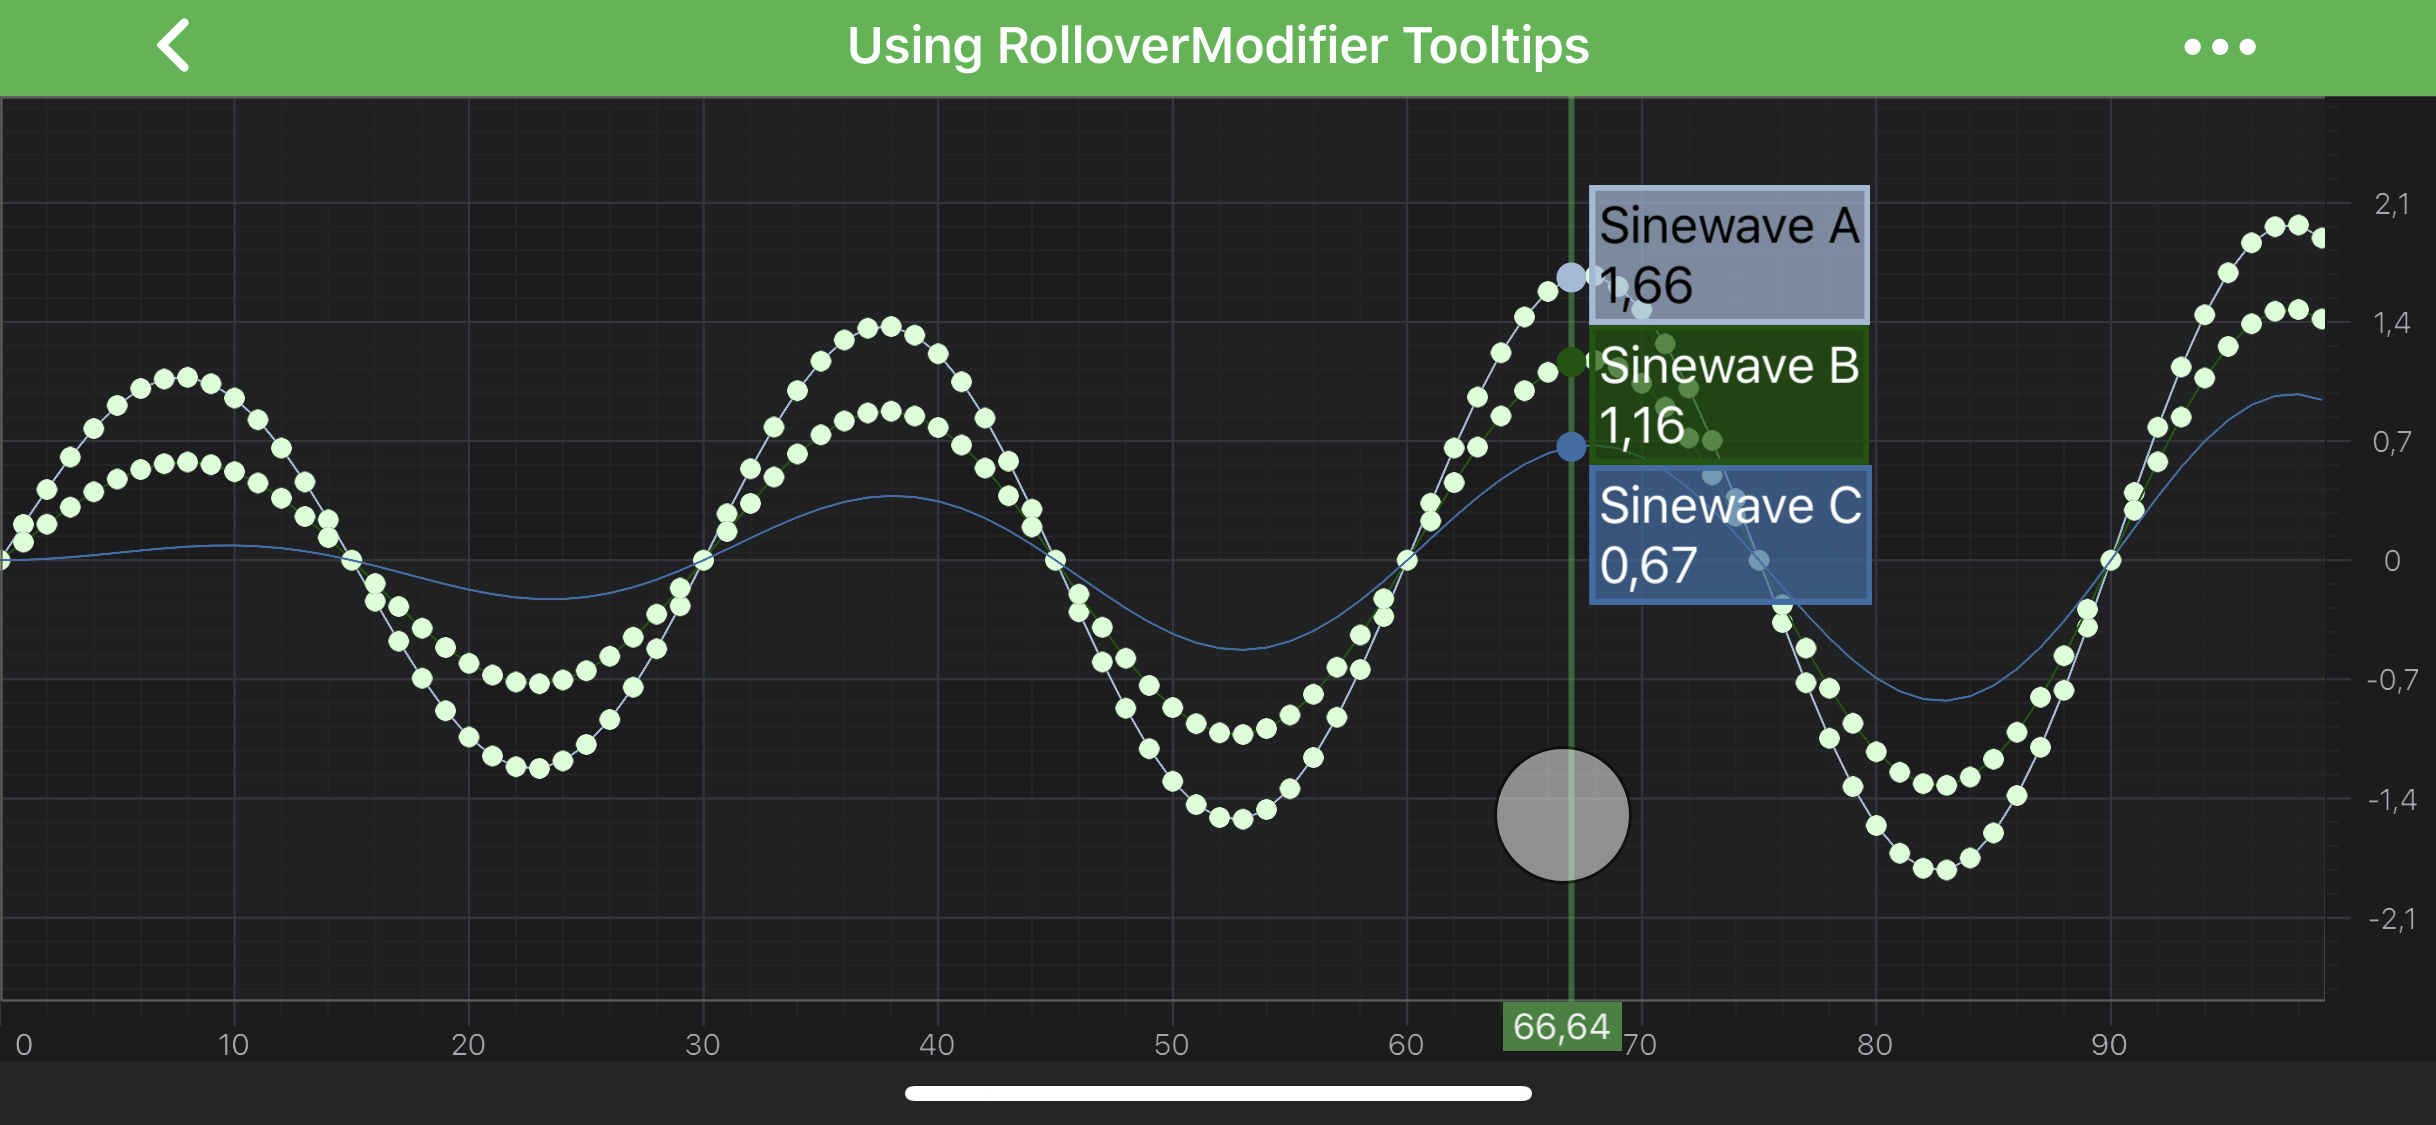
The SCIRolloverModifier can be used to show tooltips for all the series under the vertical line drawn at the touch position:
NOTE: The
SCIRolloverModifieris specifically suited to inspect data across many series are the same. For scatter charts, or irregular charts, please try the SCITooltipModifier.

NOTE: Examples of the
SCIRolloverModifierusage can be found in the SciChart iOS Examples Suite as well as on GitHub:
SCIRolloverModifier Features
Besides the SCIRolloverModifier specific features, there are some common features which are shared between SCITooltipModifier, SCIRolloverModifier and SCICursorModifier via common SCITooltipModifierBase class.
Common Features
| Feature | Description |
|---|---|
SCITooltipModifierBase.showTooltip |
Allows to hide or show modifier’s Tooltips. |
SCITooltipModifierBase.useInterpolation |
Allows to show interpolated values between data points. It is set to YES by default. If NO - modifier’s Tooltips will report the info about closest data points. |
SCITooltipModifierBase.sourceMode |
Allows to specify which ISCIRenderableSeries are to be inspected by a modifier, e.g. Visible, Selected, etc. Other will be ignored by the modifier. Expects a member of the SCISourceMode enumeration. |
Specific Features
| Feature | Description |
|---|---|
SCITooltipModifierWithAxisLabelsBase.showAxisLabel |
Allows to hide or show Rollover’s axis label |
SCIRolloverModifier.drawVerticalLine |
Allows to hide or show Rollover’s vertical line. |
SCIRolloverModifier.verticalLineStyle |
Allows to specify SCIPenStyle which will be used to draw rollover vertical line |
Adding a SCIRolloverModifier to a Chart
Any Chart Modifier can be added to a SCIChartSurface via the ISCIChartSurface.chartModifiers property and SCIRolloverModifier with no difference:
NOTE: To learn more about features available, please visit the Chart Modifier APIs article.
 View on GitHub