 View on GitHub
iOS & macOS Charting Documentation - SciChart iOS & macOS Charts SDK v4.x
Axis Ranging - VisibleRange and DataRange
Every axis type can work with a specific range type that conforms to the ISCIRange protocol. It depends on the data type that the axis can work with. Please review the article on axis types to learn more.
Range Types in SciChart
The most important range types are:
SCIDoubleRange- used on Numeric Axis types.SCIDateRange- used by Date Axis types.
SciChart introduces the concepts of a VisibleRange and the DataRange of an axis, which are instances of the Range types listed above and other inheritors of ISCIRange.
What is DataRange?
ISCIAxisCore.dataRange is a property exposed by the axis, which tells you the range (Max, Min) of the DataSeries associated with that axis.
DataRange completely depends on the chart data and doesn’t change without data changes. The DataRange can be accessed via the ISCIAxisCore.dataRange property.
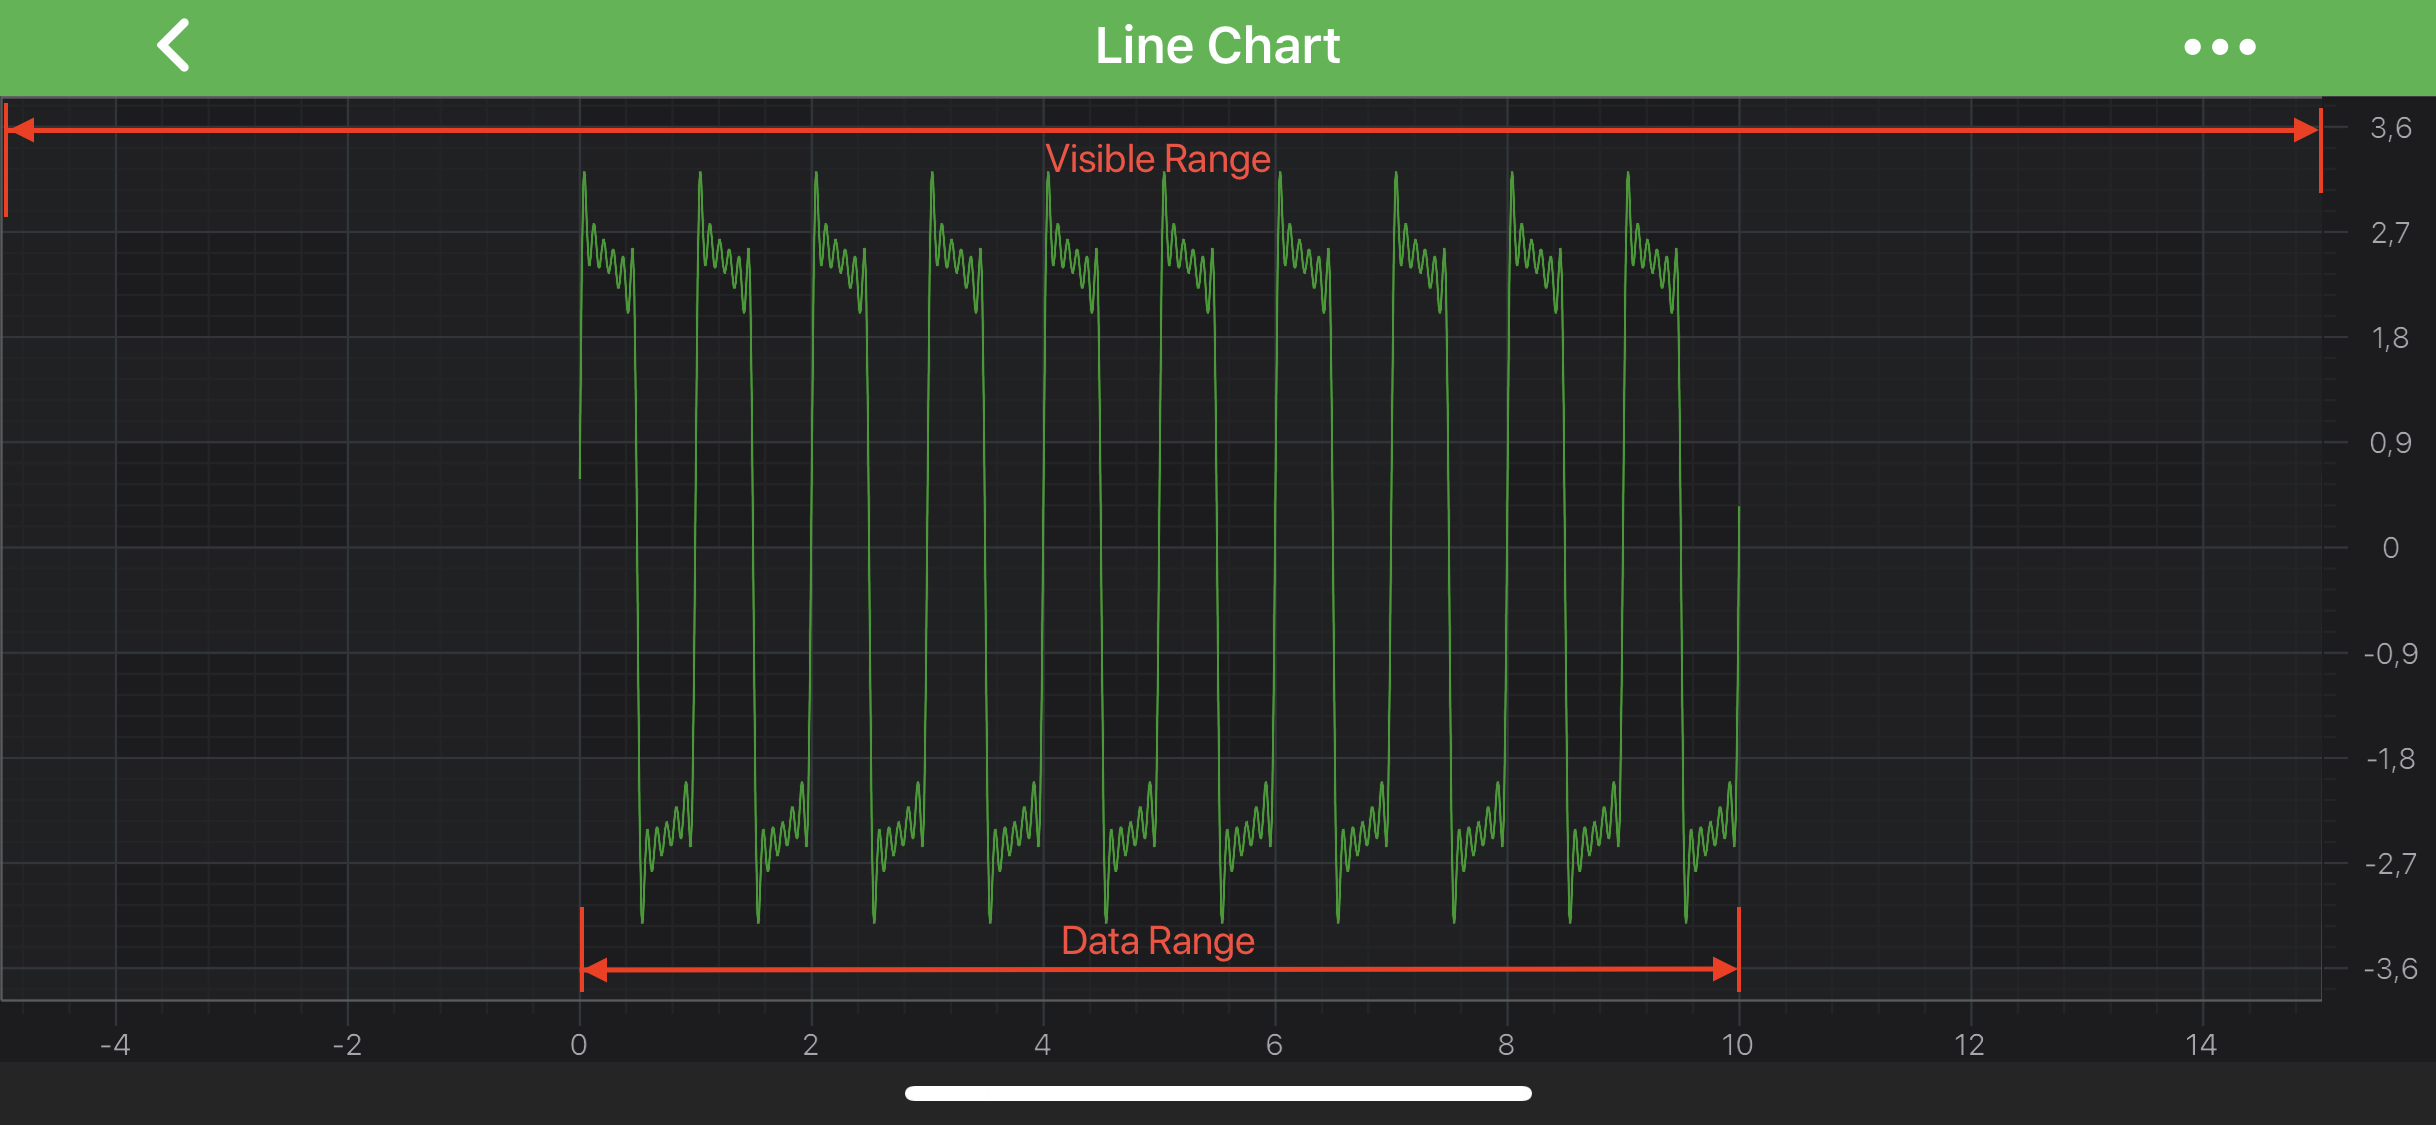
What is VisibleRange?
ISCIAxisCore.visibleRange is an actual axis range, measured in chart units. This is a part of a chart that is currently visible in a viewport. So when DataRange completely depends on chart data and doesn’t change without data changes, VisibleRange can be modified to provide a different viewpoint to a chart. The VisibleRange of an axis can be accessed by the ISCIAxisCore.visibleRange property.
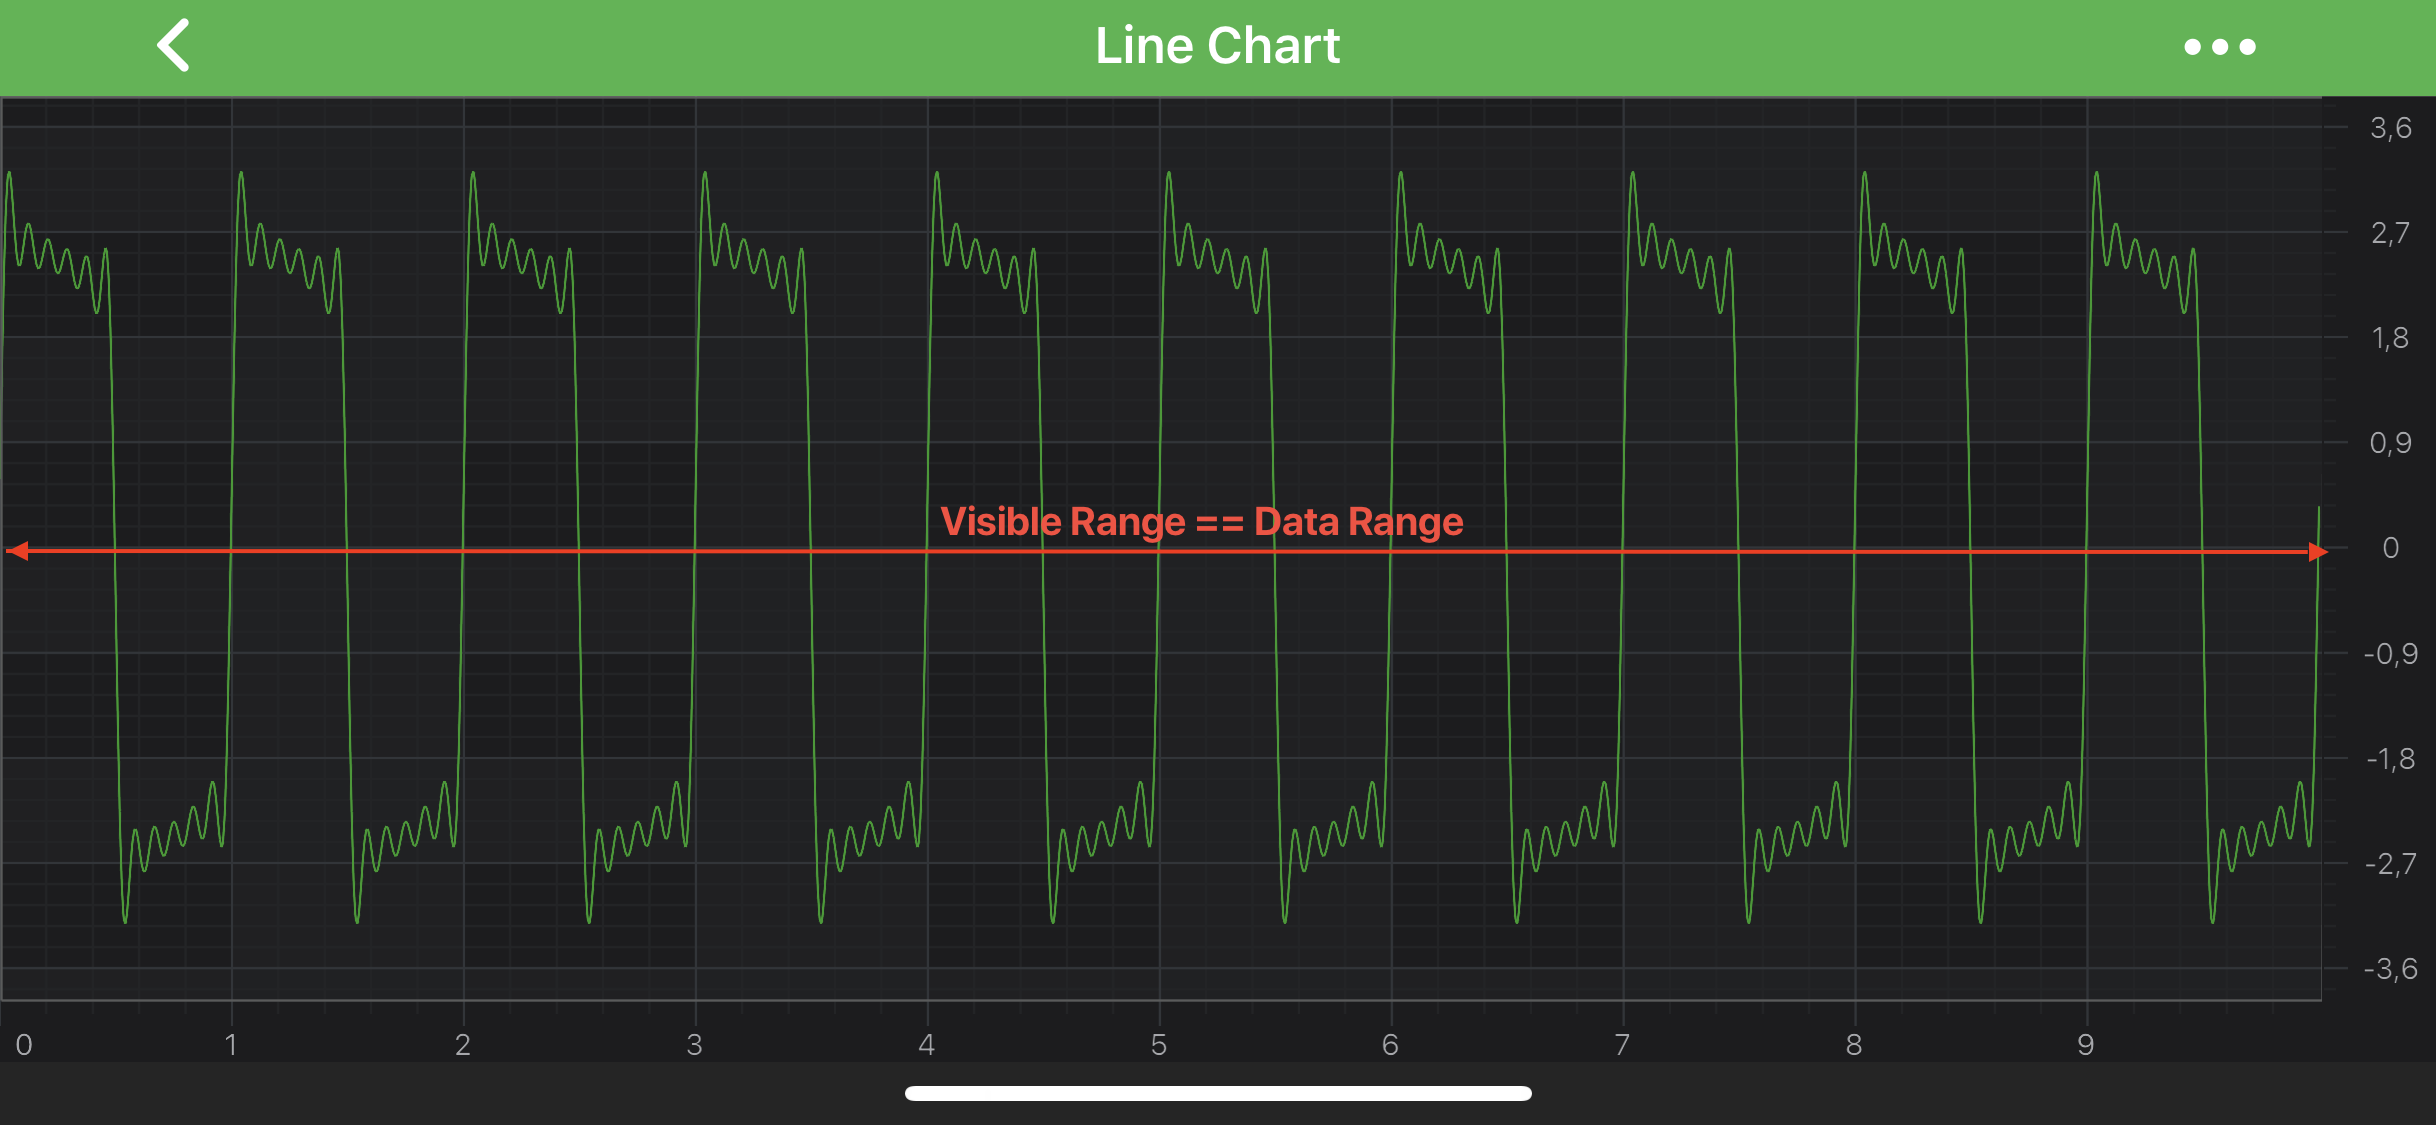
When VisibleRange == DataRange, we say the chart is zoomed to its data extents, or zoomed to fit. This can be illustrated in the image below.
The type of the Range depends on the type of the axis. For more information, see Axis Ranging - Setting and Getting VisibleRange.