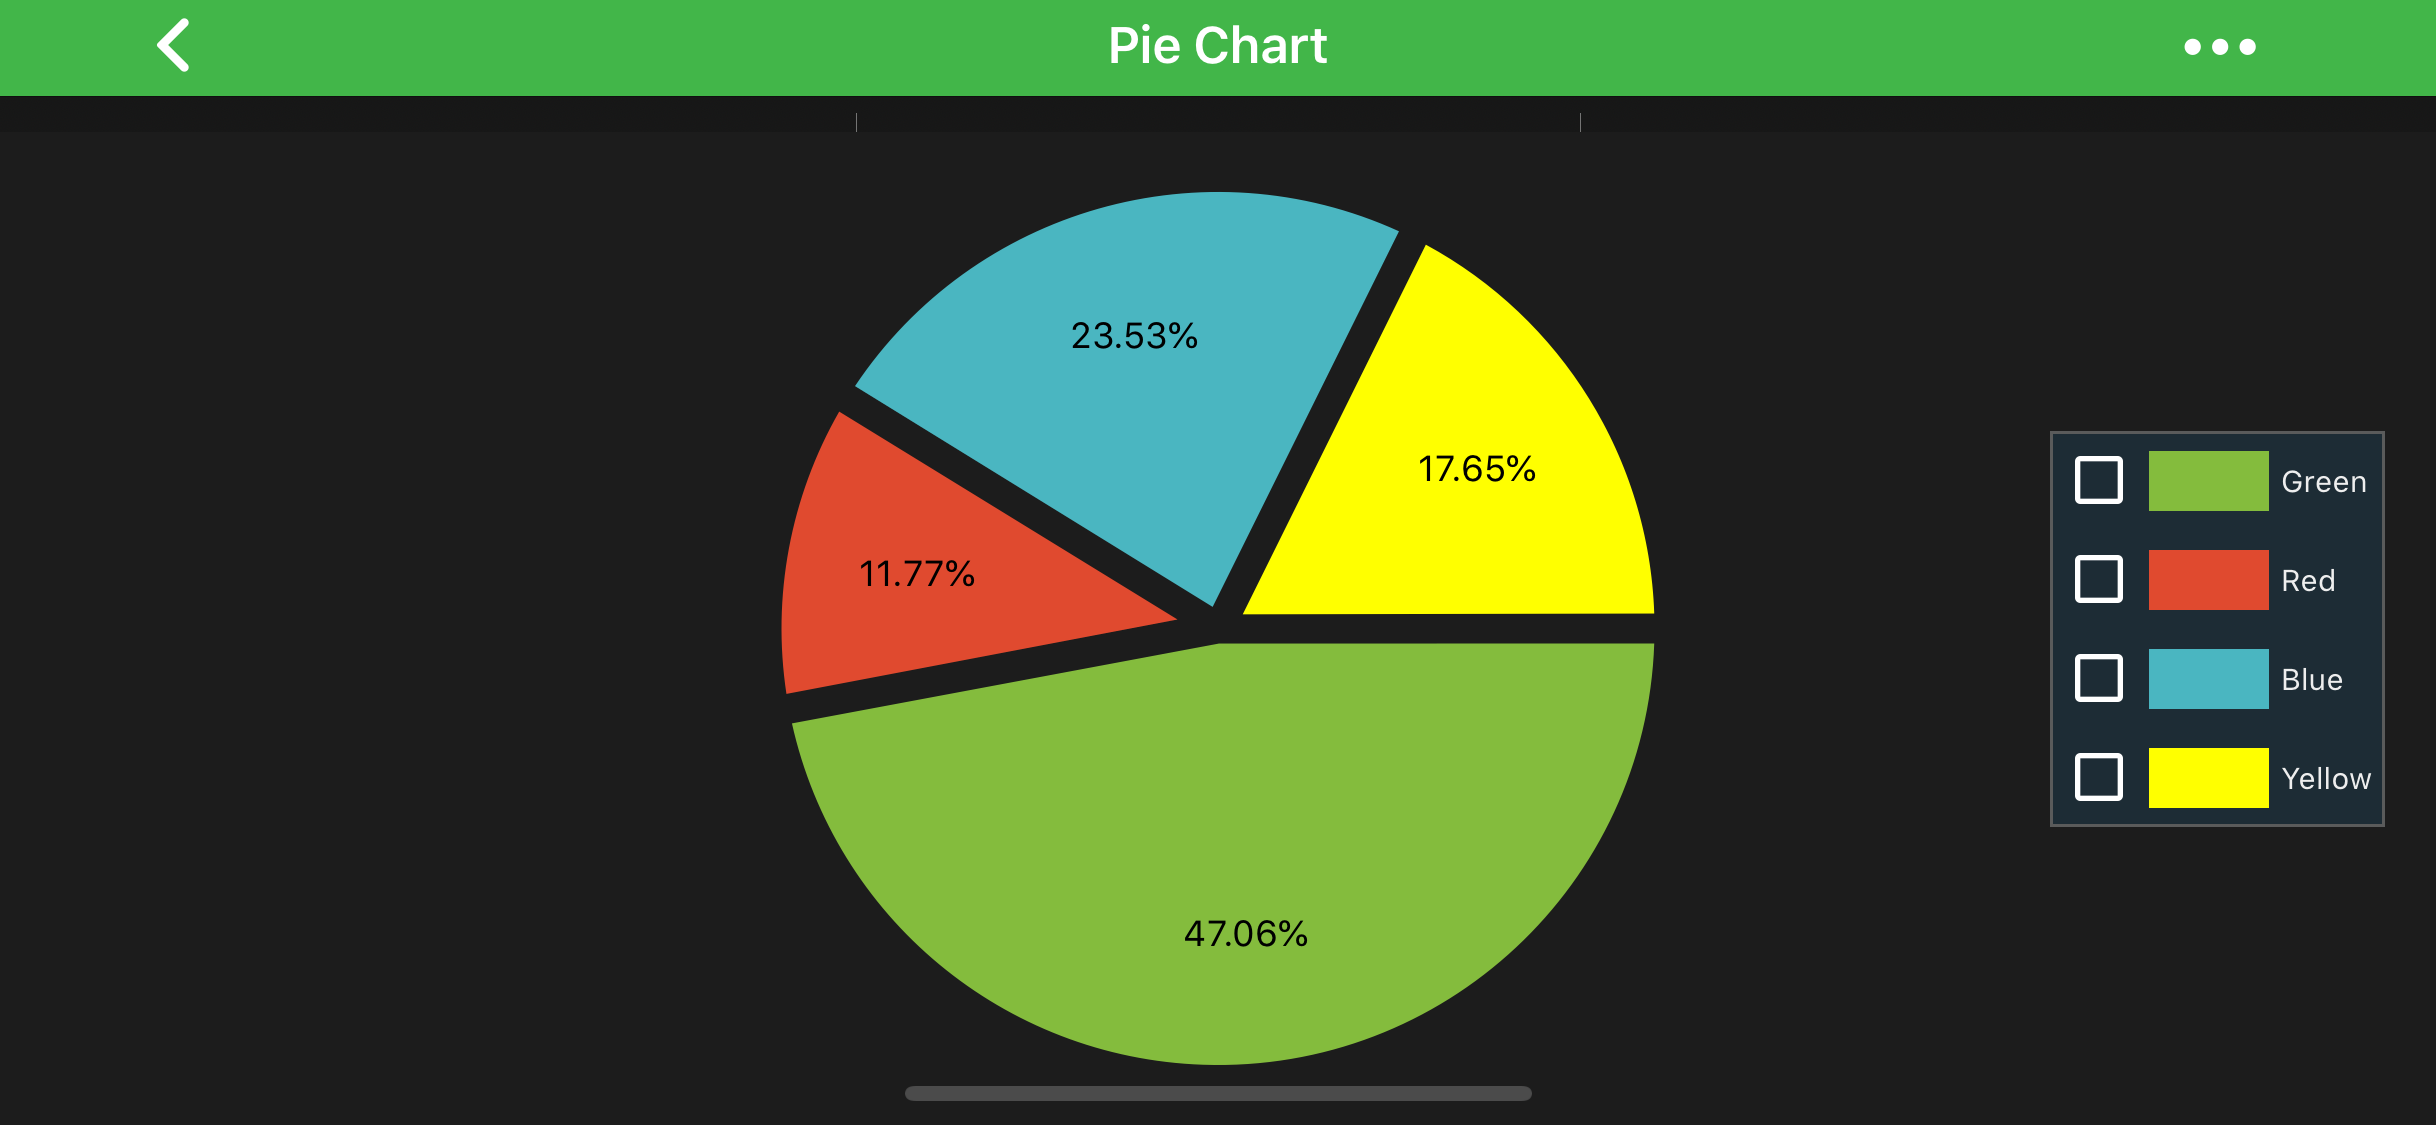
In SciChart, the Pie Chart type is represented by the SCIPieChartSurface class.
The SCIPieRenderableSeries represents data in a form of a circle divided into triangular wedges, called segments.
A SCIPieSegment represents a percentage that corresponds to a particular value.
This value appears drawn on every segment and can be set in code.
// Assume a surface has been created and configured somewhere
SCIPieChartSurface pieChartSurface;
// Create Pie Series and fill it with Segments
SCIPieRenderableSeries *pieSeries = [SCIPieRenderableSeries new];
[pieSeries.segmentsCollection add:[self segmentWithValue:40 title:@“Green” centerColor:0xff84BC3D edgeColor:0xff5B8829]];
[pieSeries.segmentsCollection add:[self segmentWithValue:10 title:@“Red” centerColor:0xffe04a2f edgeColor:0xffB7161B]];
[pieSeries.segmentsCollection add:[self segmentWithValue:20 title:@“Blue” centerColor:0xff4AB6C1 edgeColor:0xff2182AD]];
[pieSeries.segmentsCollection add:[self segmentWithValue:15 title:@“Yellow” centerColor:0xffFFFF00 edgeColor:0xfffed325]];
[pieChartSurface.renderableSeries add:pieSeries];
- (SCIPieSegment *)segmentWithValue:(double)segmentValue title:(NSString *)title centerColor:(unsigned int)centerColor edgeColor:(unsigned int)edgeColor {
SCIPieSegment *segment = [SCIPieSegment new];
segment.value = segmentValue;
segment.title = title;
segment.fillStyle = [[SCIRadialGradientBrushStyle alloc] initWithCenterColorCode:centerColor edgeColorCode:edgeColor];
return segment;
}
// Assume a surface has been created and configured somewhere
let pieChartSurface: SCIPieChartSurface
// Create Pie Series and fill it with Segments
let pieSeries = SCIPieRenderableSeries()
pieSeries.segmentsCollection.add(segmentWithValue(segmentValue: 40, title: “Green”, centerColor: 0xff84BC3D, edgeColor: 0xff5B8829))
pieSeries.segmentsCollection.add(segmentWithValue(segmentValue: 10, title: “Red”, centerColor: 0xffe04a2f, edgeColor: 0xffB7161B))
pieSeries.segmentsCollection.add(segmentWithValue(segmentValue: 20, title: “Blue”, centerColor: 0xff4AB6C1, edgeColor: 0xff2182AD))
pieSeries.segmentsCollection.add(segmentWithValue(segmentValue: 15, title: “Yellow”, centerColor: 0xffFFFF00, edgeColor: 0xfffed325))
pieChartSurface.renderableSeries.add(pieSeries)
func segmentWithValue(segmentValue: Double, title: String, centerColor: UInt32, edgeColor: UInt32) -> SCIPieSegment {
let segment = SCIPieSegment()
segment.value = segmentValue
segment.title = title
segment.fillStyle = SCIRadialGradientBrushStyle(centerColorCode: centerColor, edgeColorCode: edgeColor)
return segment
}
// Assume a surface has been created and configured somewhere
SCIPieChartSurface pieChartSurface;
// Create Pie Series and fill it with Segments
var pieSeries = new SCIPieRenderableSeries
{
SegmentsCollection = new SCIPieSegmentCollection
{
new SCIPieSegment { Value = 40, Title = “Green”, FillStyle = new SCIRadialGradientBrushStyle(0xff84BC3D, 0xff5B8829) },
new SCIPieSegment { Value = 10, Title = “Red”, FillStyle = new SCIRadialGradientBrushStyle(0xffe04a2f, 0xffB7161B) },
new SCIPieSegment { Value = 20, Title = “Blue”, FillStyle = new SCIRadialGradientBrushStyle(0xff4AB6C1, 0xff2182AD) },
new SCIPieSegment { Value = 15, Title = “Yellow”, FillStyle = new SCIRadialGradientBrushStyle(0xffFFFF00, 0xfffed325) },
},
};
pieChartSurface.RenderableSeries.Add(pieSeries);
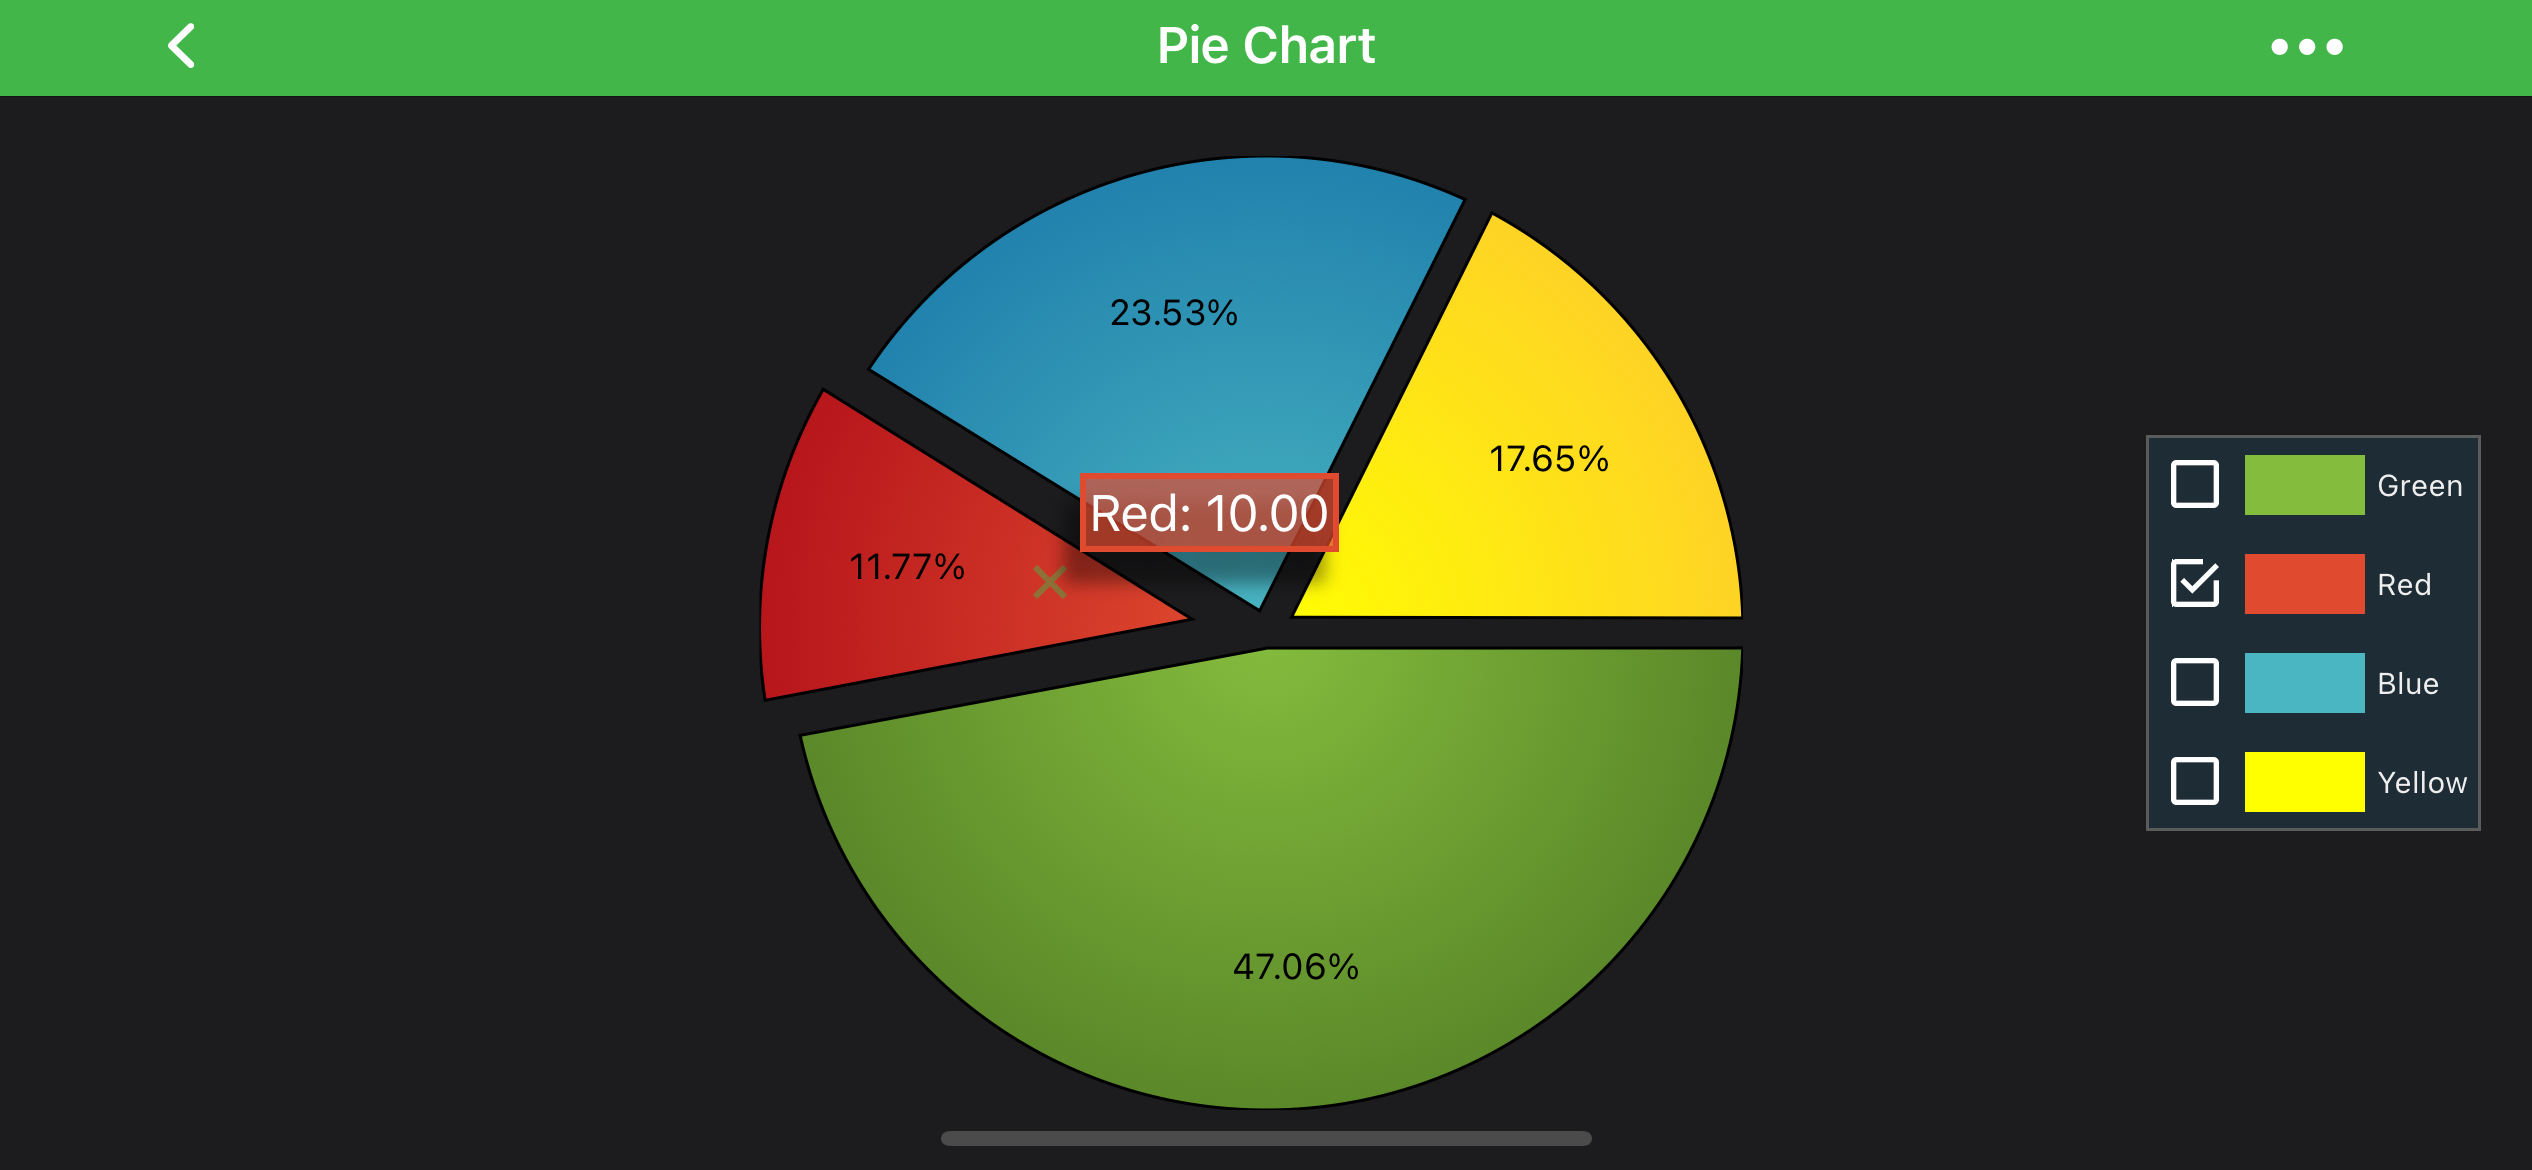
Legend and Selection modifiers are synced if both are added. A SCIPieSegment can be selected by clicking on either of them (via the Selection Modifier) or the corresponding item in the Legend.
This action provides visual feedback on the chart and the Legend.
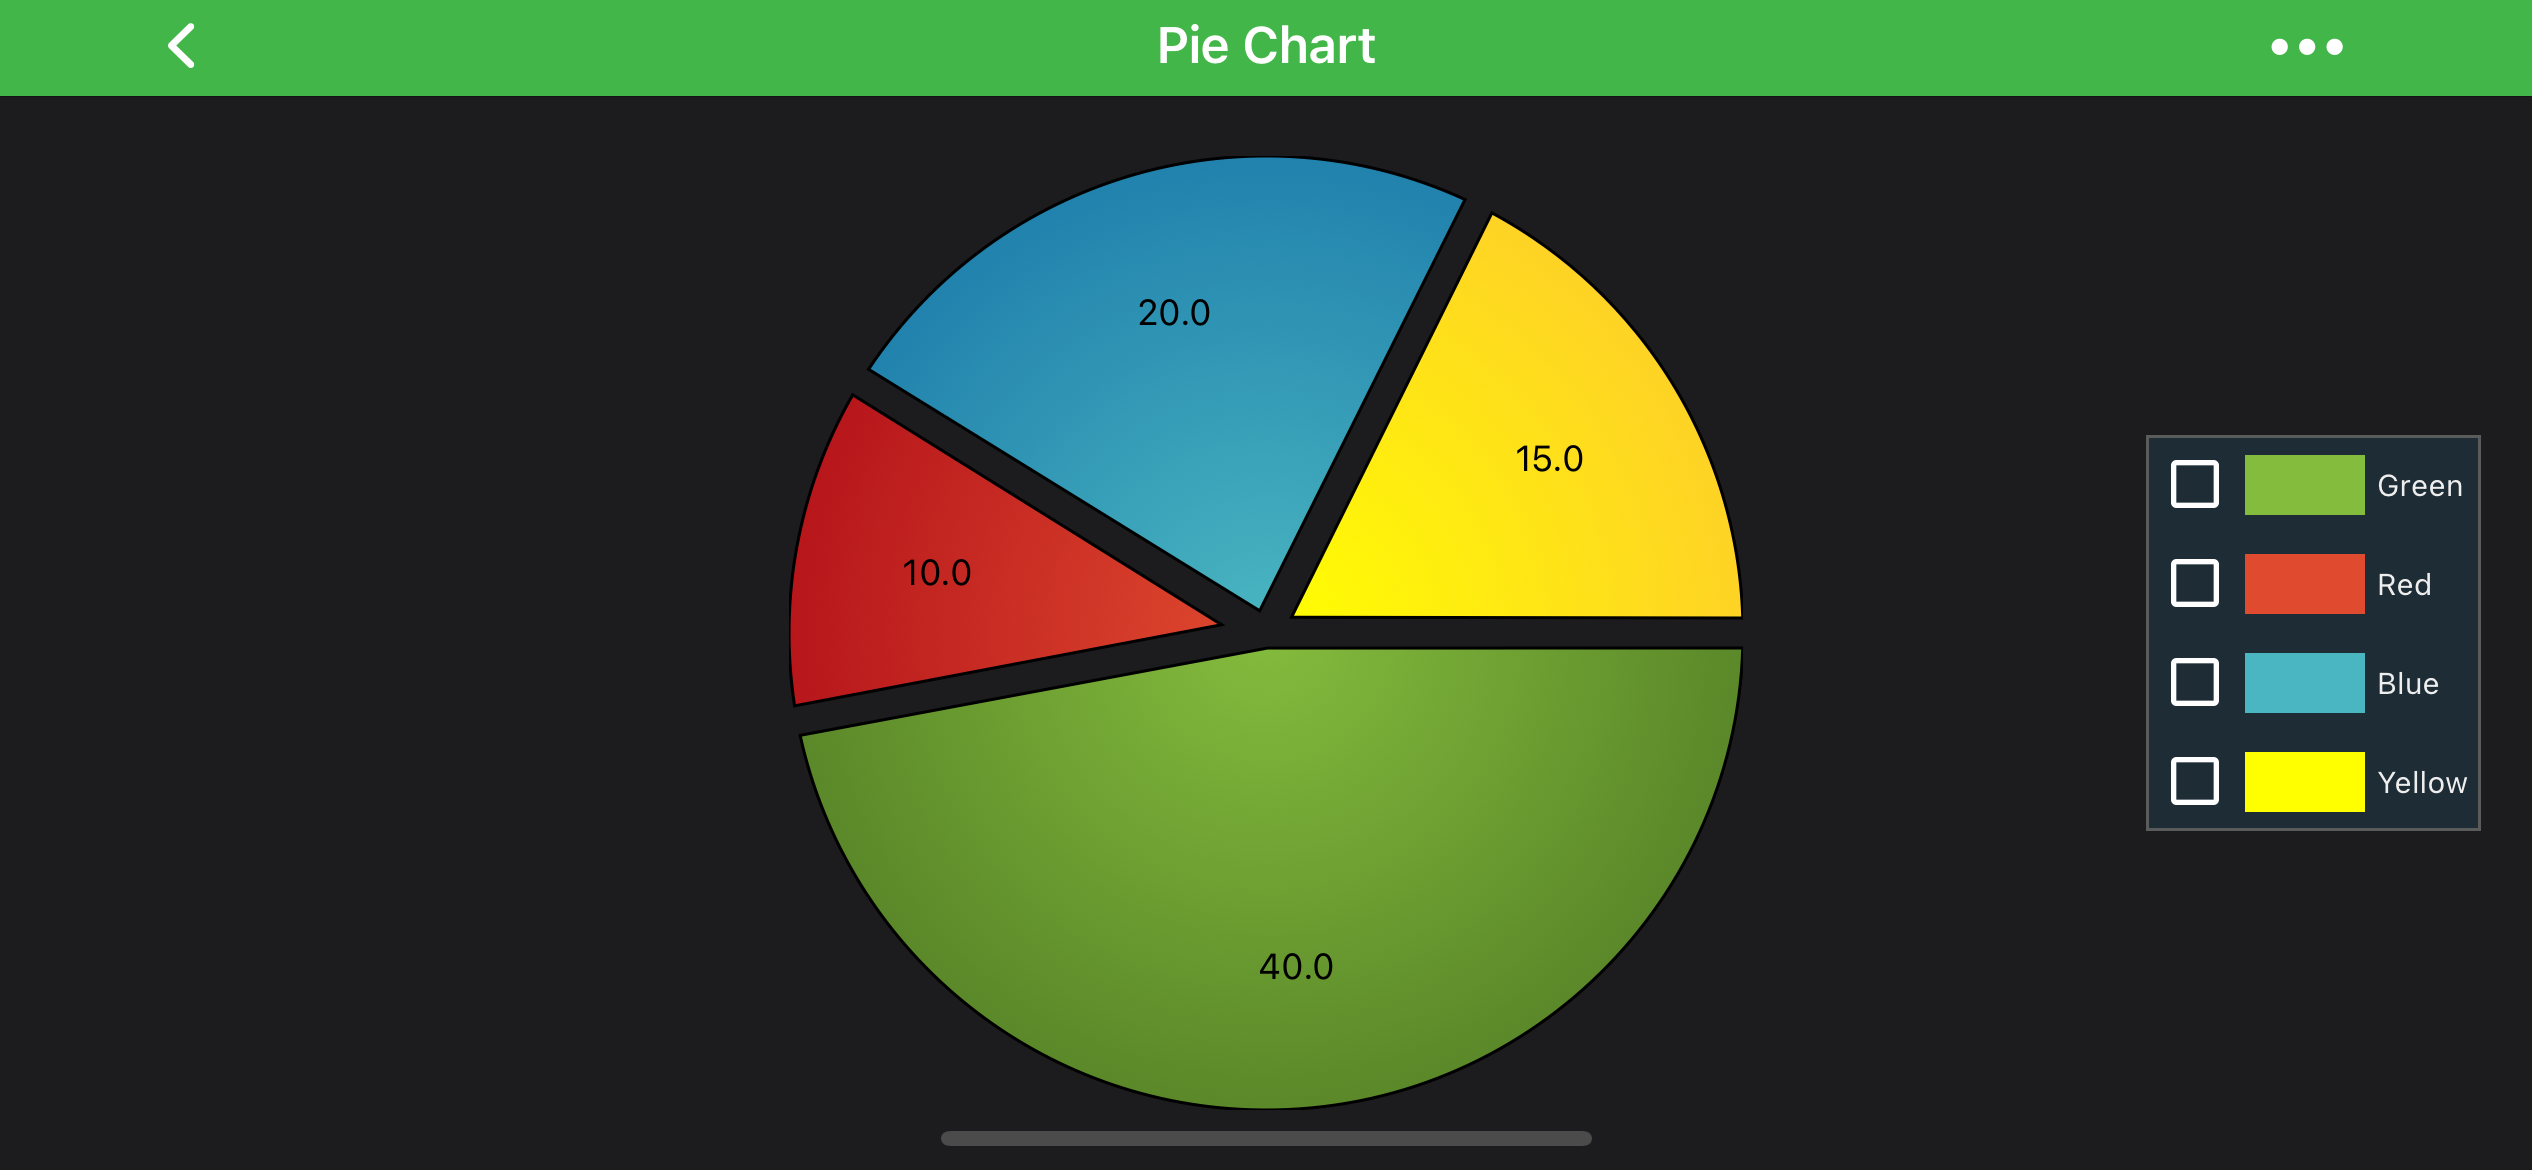
By default, the Pie Segment Label displays a relative percentage calculated on values of all segments in SCIPieDonutRenderableSeriesBase.segmentsCollection. This behavior can be controlled and to do so you’ll need to subclass SCIPieSegmentLabelFormatterBase and provide your custom data in -[ISCIPieSegmentLabelFormatter formatLabelForPieSegment:] method. As an example, let’s create a label that displays a segment absolute value. Assume, we create a donutSeries and add four segments with values 40, 10, 20, and 15. Here is the code sample, how to do this:
// CustomPieSegmentLabelFormatter.h
@interface CustomPieSegmentLabelFormatter : SCIPieSegmentLabelFormatterBase
@end
// CustomPieSegmentLabelFormatter.m
@implementation CustomPieSegmentLabelFormatter
- (NSString *)formatLabelForPieSegment:(id)pieSegment {
return [NSString stringWithFormat:@“%f”, pieSegment.value];
}
@end
// Assume a donutSeries has been created somewhere
SCIDonutRenderableSeries *donutSeries = [SCIDonutRenderableSeries new];
donutSeries.pieSegmentLabelFormatter = [CustomPieSegmentLabelFormatter new];
class CustomPieSegmentLabelFormatter: SCIPieSegmentLabelFormatterBase {
override func formatLabel(for pieSegment: ISCIPieSegment!) -> String! {
return “\(pieSegment.value)”
}
}
// Assume a donutSeries has been created somewhere
let donutSeries = SCIDonutRenderableSeries()
donutSeries.pieSegmentLabelFormatter = CustomPieSegmentLabelFormatter()
class CustomPieSegmentLabelFormatter : SCIPieSegmentLabelFormatterBase
{
public override string FormatLabel(IISCIPieSegment pieSegment)
{
return pieSegment.Value.ToString();
}
}
// Assume a donutSeries has been created somewhere
var donutSeries = new SCIDonutRenderableSeries;
donutSeries.PieSegmentLabelFormatter = new CustomPieSegmentLabelFormatter();
 View on GitHub