So far, in our series of tutorials, all the charts have had one X-Axis and one Y-Axis.
SciChart supports unlimited, multiple X, and Y Axis on the left, right, bottom and top of the chart.
You can change Axis alignment, rotate charts, mix axis (have both XAxis/YAxis on the left), horizontally or vertically stack axes.
The possibilities are literally endless!
In this tutorial, we are going to:
add a second Y-Axis to the chart.
show how to register annotations and line series on the second axis.
ensure Axis drag behaviors work on both axis.
Getting Started
This tutorial is suitable for Objective-C, Swift and C# with Xamarin.iOS.
NOTE: Source code for this tutorial can be found at our Github Repository:
And have at least basic understanding of how to use SciChart.
Also, you might want to read our documentation about Axis APIs.
Adding a Second Y-Axis
The procedure to add a second axis to a SCIChartSurface is pretty much the same as with one axis with one difference.
You must assign a unique string ID to all axes if there is more than one.
To see the axis to appear to the either side of a chart, you set SCIAxisAlignment to e.g.:
// Create another numeric axis, right-aligned
var yAxisRight = new SCINumericAxis();
yAxisRight.AxisTitle = “Primary Y-Axis”;
yAxisRight.AxisId = “Primary Y-Axis”;
yAxisRight.AxisAlignment = SCIAxisAlignment.Right;
// Create another numeric axis, left-aligned
var yAxisLeft = new SCINumericAxis();
yAxisLeft.AxisTitle = “Secondary Y-Axis”;
yAxisLeft.AxisId = “Secondary Y-Axis”;
yAxisLeft.AxisAlignment = SCIAxisAlignment.Left;
yAxisLeft.GrowBy = new SCIDoubleRange(0.2, 0.2);
// …
Surface.XAxes.Add(new SCINumericAxis());
Surface.YAxes.Add(yAxisLeft);
Surface.YAxes.Add(yAxisRight);
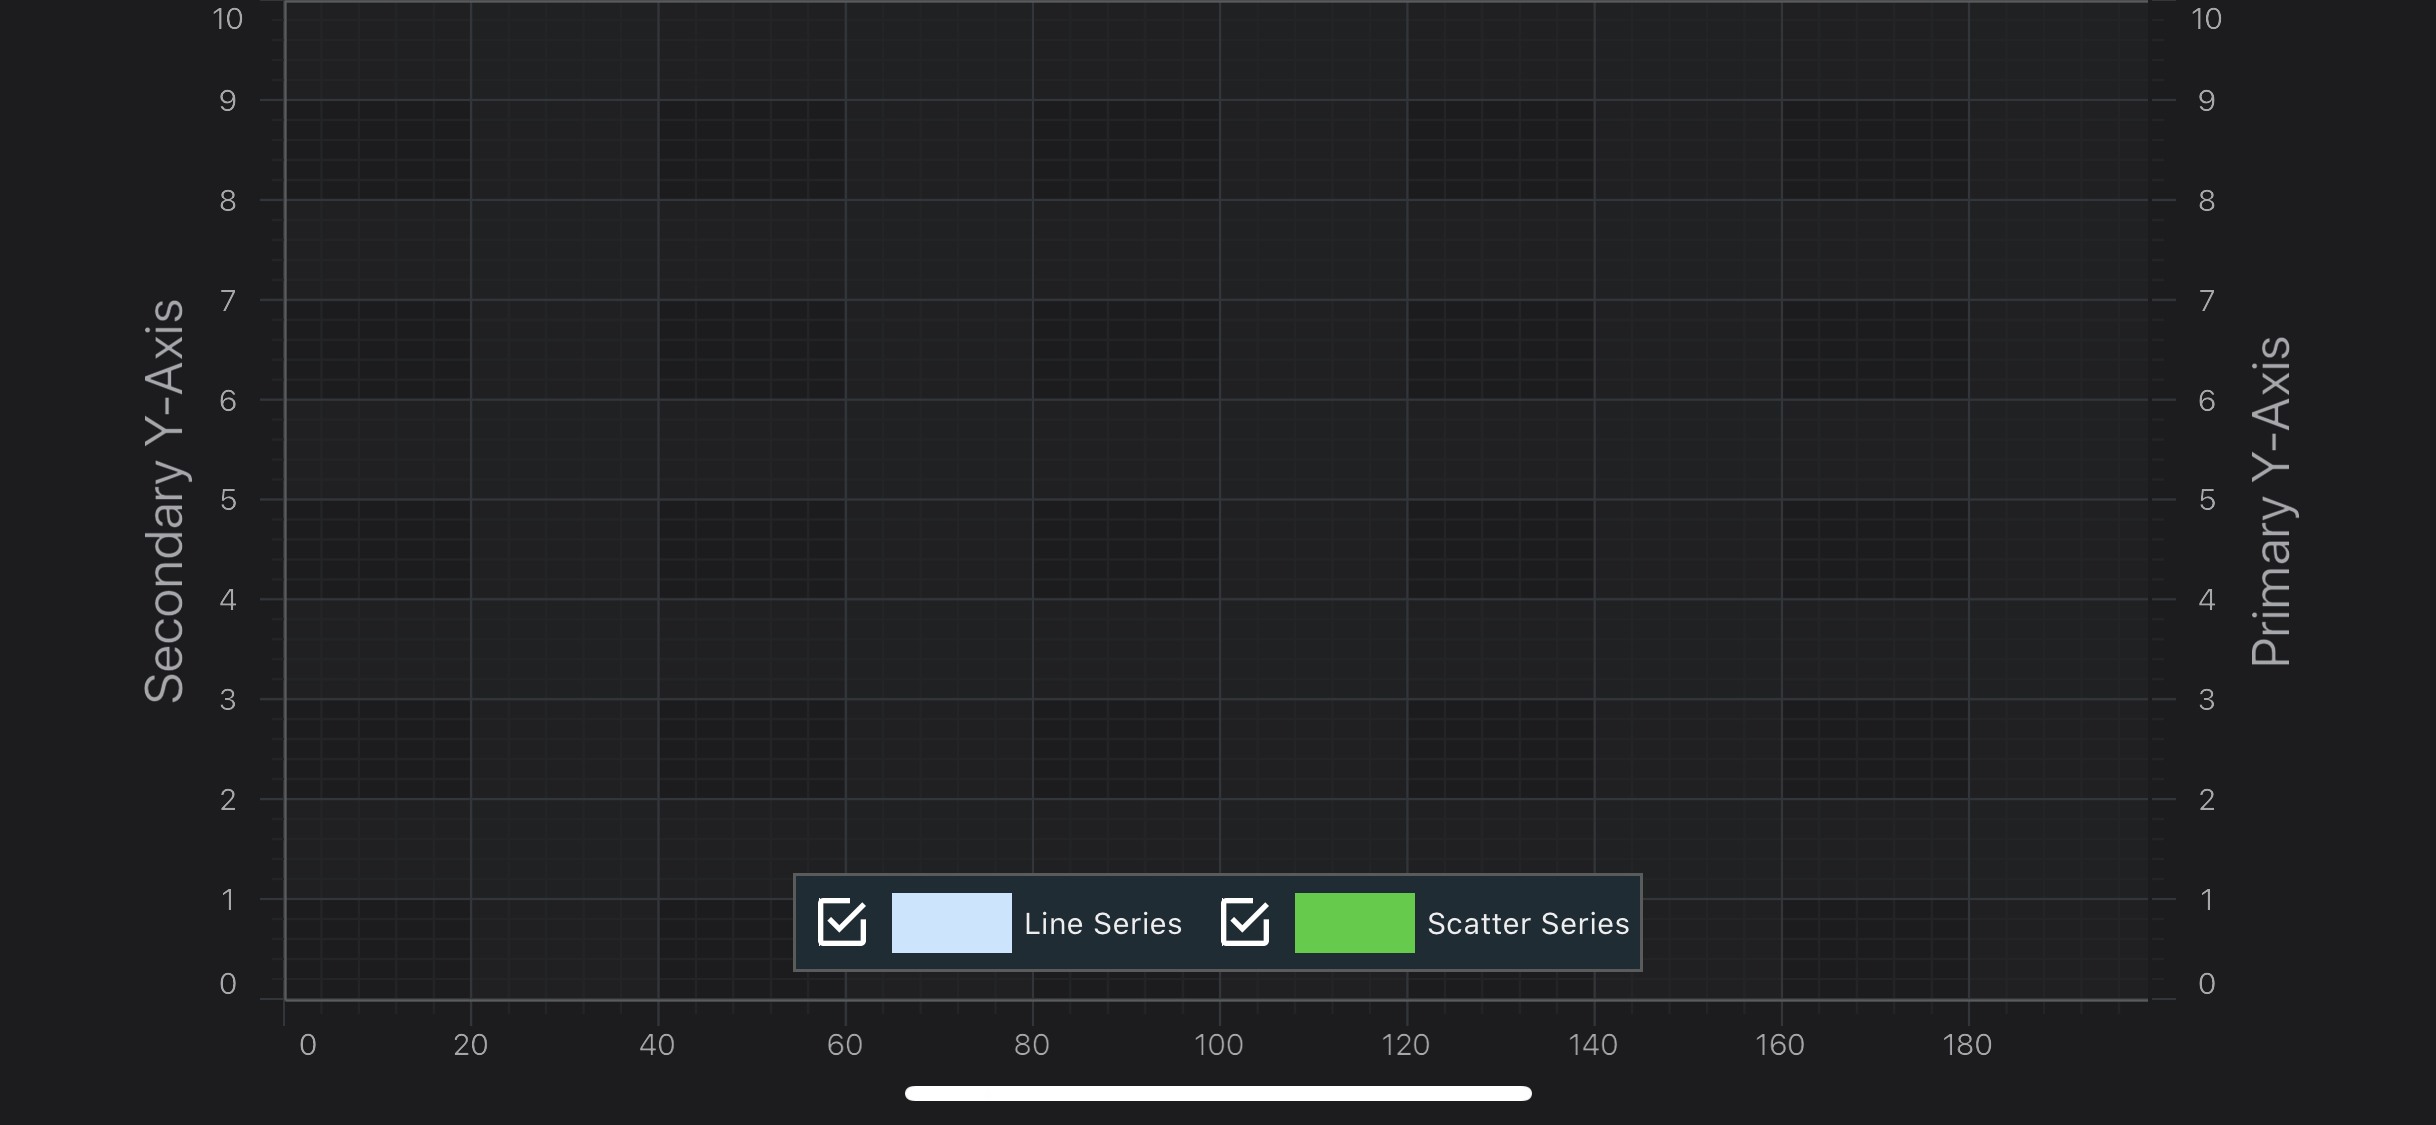
Now we can see the second axis in our application:
NOTE:Annotations and RenderableSeries don’t get rendered now
Registering RenderableSeries on the Second Y-Axis
If there are several Y or X axes, you need to register other chart parts, like RenderableSeries and Annotations, on a particular axis to be measured against its scale.
From the tutorial, we are going to attach one series to the right axis and the other to the left axis, passing corresponding IDs to the RenderableSeries:
let lineSeries = SCIFastLineRenderableSeries()
lineSeries.yAxisId = “Primary Y-Axis”
let scatterSeries = SCIXyScatterRenderableSeries()
scatterSeries.yAxisId = “Secondary Y-Axis”
var lineSeries = new SCIFastLineRenderableSeries { DataSeries = lineDataSeries, YAxisId = “Primary Y-Axis” };
var scatterSeries = new SCIXyScatterRenderableSeries
{
YAxisId = “Secondary Y-Axis”,
DataSeries = scatterDataSeries,
PointMarker = new SCIEllipsePointMarker { FillStyle = new SCISolidBrushStyle(0xFF32CD32), Size = new CGSize(10, 10) }
};
Which results in the following:
Registering Annotations on the Second Y-Axis
Annotations also need to be registered on a certain axis in a multi-axis scenario.
So we are going to alternate the axis IDs to annotations in on our chart for the left or right axes in the following way:
Finally, start exploring. The SciChart iOS is quite extensive.
You can look into our SciChart iOS Examples Suite which are full of 2D and 3D examples, which are also available on our GitHub.
 View on GitHub