 View on GitHub
iOS & macOS Charting Documentation - SciChart iOS & macOS Charts SDK v4.x
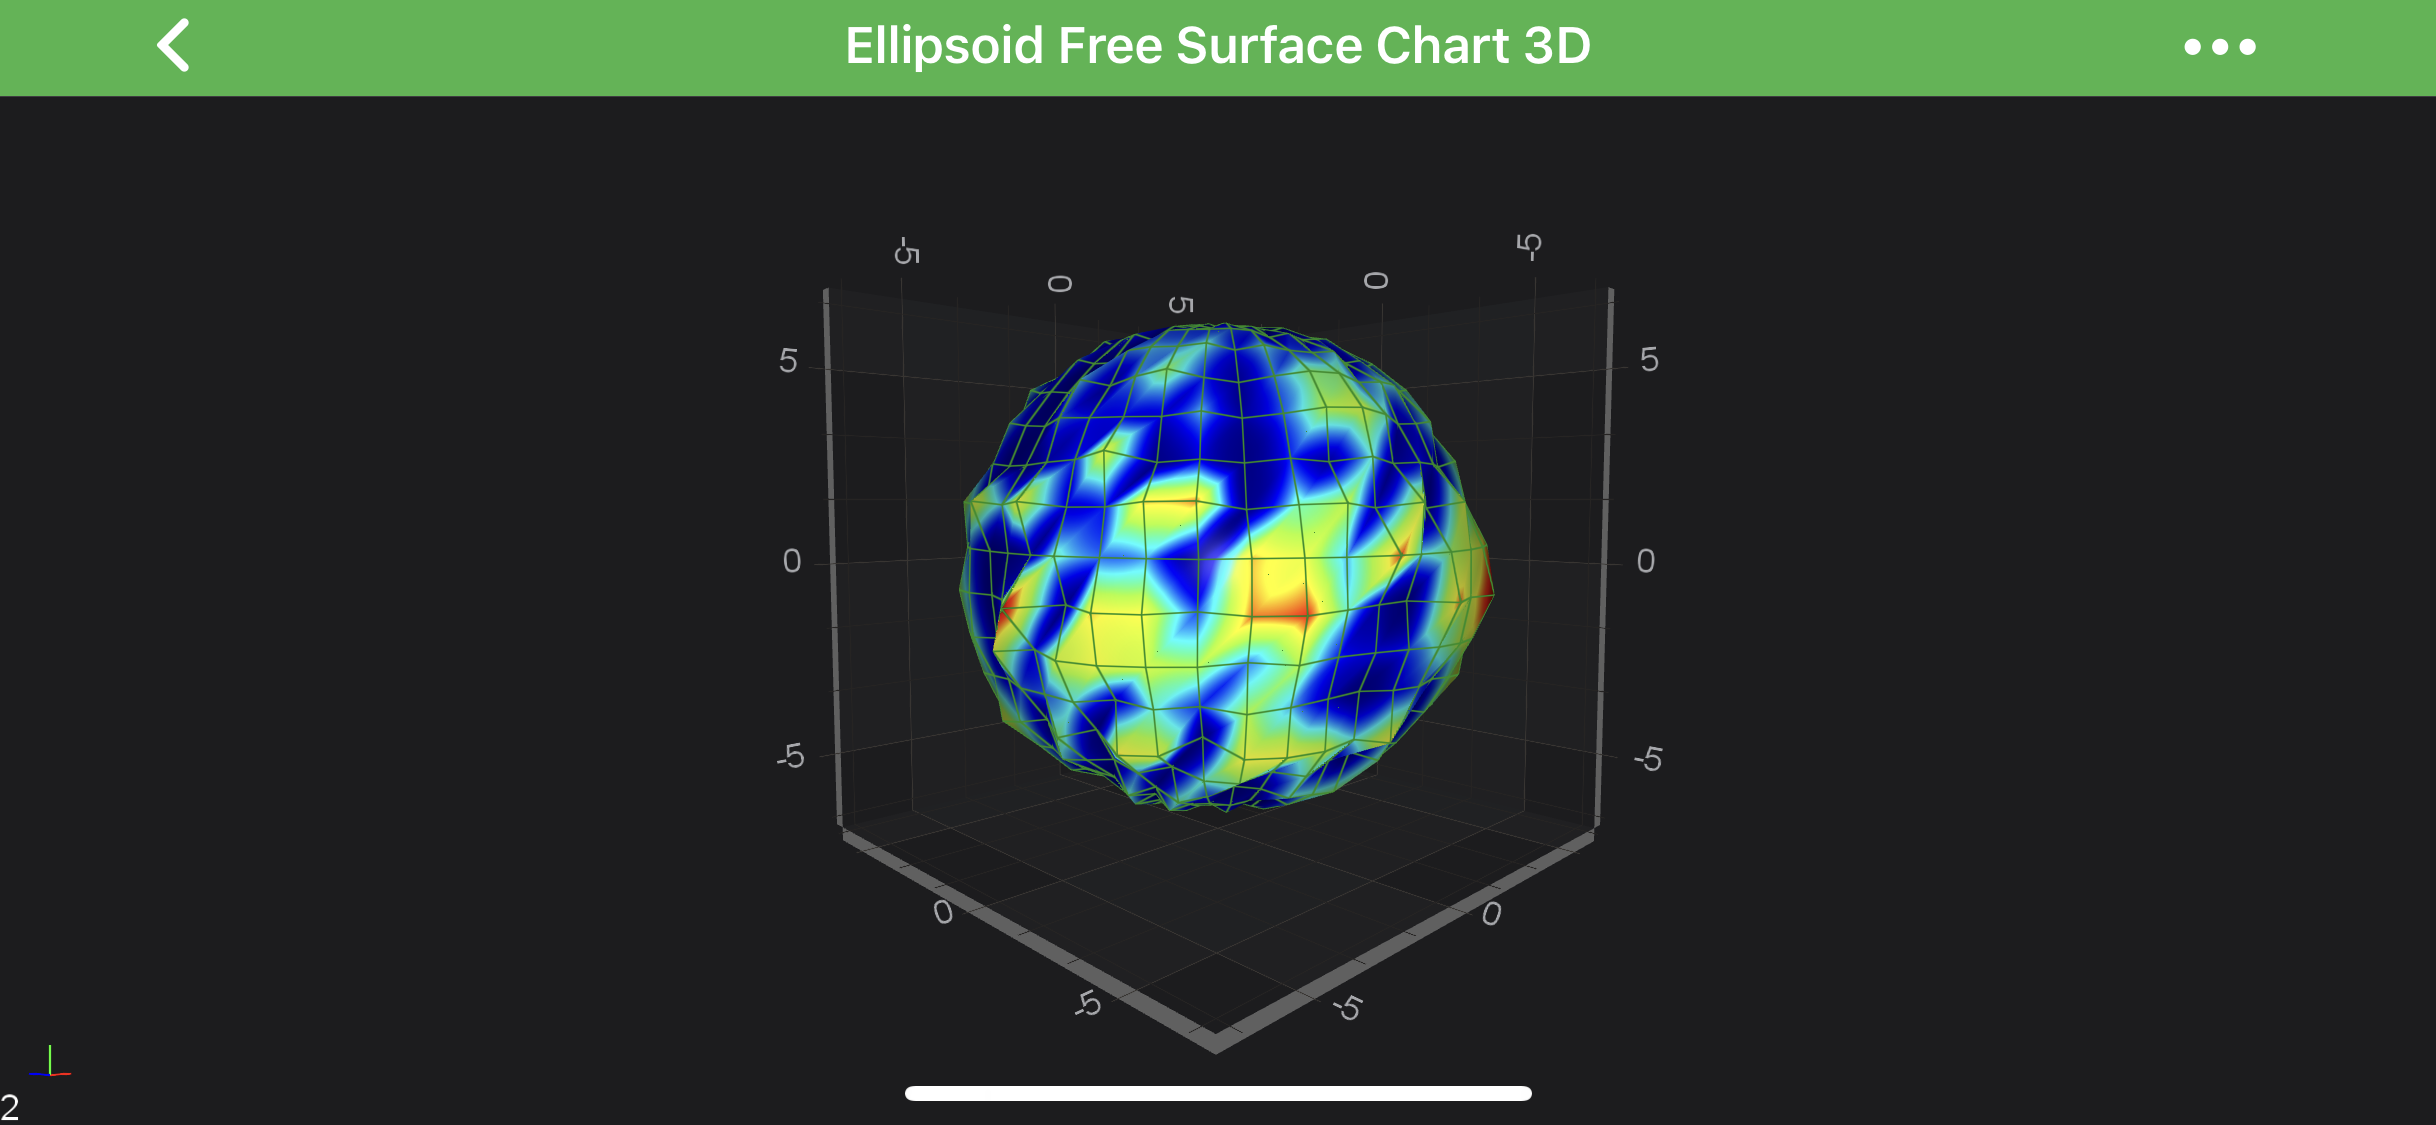
The Ellipsoid 3D Chart Type
In SciChart, Ellipsoid 3D Charts are provided by the combination of the Free Surface 3D Series and SCIEllipsoidDataSeries3D underlying DataSeries.
The location of the SCIEllipsoidDataSeries3D is defined by following properties:
ISCIFreeSurfaceDataSeries3DValues.offsetX– a location of the Ellipsoid by theX-Axis;ISCIFreeSurfaceDataSeries3DValues.offsetY– a location of the Ellipsoid by theY-Axis;ISCIFreeSurfaceDataSeries3DValues.offsetZ– a location of the Ellipsoid by theZ-Axis;
The size of the SCIEllipsoidDataSeries3D is defined by following properties:
SCIEllipsoidDataSeries3D.a– a radius of the Ellipsoid along theX-Axis;SCIEllipsoidDataSeries3D.b– a radius of the Ellipsoid along theY-Axis;SCIEllipsoidDataSeries3D.c– a radius of the Ellipsoid along theZ-Axis;
NOTE: Examples for the Ellipsoid Series 3D can be found in the SciChart iOS Examples Suite as well as on GitHub:
Create a Ellipsoid 3D Chart
To create a Ellipsoid 3D Chart, use the following code:
const int sizeU = 40;
const int sizeV = 20;
SCIEllipsoidDataSeries3D *ds = [[SCIEllipsoidDataSeries3D alloc] initWithDataType:SCIDataType_Double uSize:sizeU vSize:sizeV];
ds.a = @(6);
ds.b = @(6);
ds.c = @(6);
for (int u = 0; u < sizeU; ++u) {
for (int v = 0; v < sizeV; ++v) {
double weight = 1.0 - ABS(2. * v / sizeV - 1.0);
double offset = [SCDRandomUtil nextDouble];
[ds setDisplacement:@(offset * weight) uIndex:u vIndex:v];
}
}
unsigned int colors[7] = { 0xFF00008B, 0xFF0000FF, 0xFF00FFFF, 0xFFADFF2F, 0xFFFFFF00, 0xFFFF0000, 0xFF8B0000 };
float stops[7] = { 0.0, 0.1, 0.3, 0.5, 0.7, 0.9, 1.0};
SCIGradientColorPalette *palette = [[SCIGradientColorPalette alloc] initWithColors:colors stops:stops count:7];
SCIFreeSurfaceRenderableSeries3D *rs0 = [SCIFreeSurfaceRenderableSeries3D new];
rs0.dataSeries = ds;
rs0.drawMeshAs = SCIDrawMeshAs_SolidWireframe;
rs0.stroke = 0x77228B22;
rs0.contourInterval = 0.1;
rs0.contourStroke = 0x77228B22;
rs0.strokeThickness = 2.0;
rs0.lightingFactor = 0.8;
rs0.meshColorPalette = palette;
rs0.paletteMinMaxMode = SCIFreeSurfacePaletteMinMaxMode_Relative;
rs0.paletteMinimum = [[SCIVector3 alloc] initWithX:0.0 y:6.0 z:0.0];
rs0.paletteMaximum = [[SCIVector3 alloc] initWithX:0.0 y:7.0 z:0.0];
let SizeU: Int = 40
let SizeV: Int = 20
let meshDataSeries = SCIEllipsoidDataSeries3D(dataType: .double, uSize: SizeU, vSize: SizeV)
meshDataSeries.set(a: 6.0)
meshDataSeries.set(b: 6.0)
meshDataSeries.set(c: 6.0)
for u in 0 ..< SizeU {
for v in 0 ..< SizeV {
let weight = 1.0 - abs(2.0 * Double(v) / Double(SizeV) - 1.0)
let offset = 1 - SCDRandomUtil.nextDouble()
meshDataSeries.setDisplacement(offset * weight, atU: u, v: v)
}
}
let colors: [UInt32] = [0xFF1D2C6B, 0xFF0000FF, 0xFF00FFFF, 0xFFADFF2F, 0xFFFFFF00, 0xFFFF0000, 0xFF8B0000]
let stops: [Float] = [0.0, 0.1, 0.3, 0.5, 0.7, 0.9, 1.0]
let palette = SCIGradientColorPalette(colors: colors, stops: stops, count: 7)
let rs0 = SCIFreeSurfaceRenderableSeries3D()
rs0.dataSeries = meshDataSeries
rs0.drawMeshAs = .solidWireframe
rs0.stroke = 0x77228B22
rs0.contourInterval = 0.1
rs0.contourStroke = 0x77228B22
rs0.strokeThickness = 2.0
rs0.lightingFactor = 0.8
rs0.meshColorPalette = palette
rs0.paletteMinMaxMode = .relative
rs0.paletteMinimum = SCIVector3(x: 0.0, y: 6.0, z: 0.0)
rs0.paletteMaximum = SCIVector3(x: 0.0, y: 7.0, z: 0.0)
const int uSize = 40, vSize = 20;
var dataSeries3D = new EllipsoidDataSeries3D<double>(uSize, vSize) { A = 6, B = 6, C = 6 };
var random = new Random();
for (int u = 0; u < uSize; u++)
{
for (int v = 0; v < vSize; v++)
{
var weightV = 1d - Math.Abs(2d * v / vSize - 1d);
var offset = random.NextDouble();
dataSeries3D.SetDisplacement(u, v, offset * weightV);
}
}
var rSeries3D = new SCIFreeSurfaceRenderableSeries3D
{
DataSeries = dataSeries3D,
DrawMeshAs = SCIDrawMeshAs.SolidWireframe,
Stroke = 0x77228B22,
ContourInterval = 0.1f,
ContourStroke = 0x77228B22,
StrokeThickness = 1f,
MeshColorPalette = new SCIGradientColorPalette(
new[] { ColorUtil.Sapphire, ColorUtil.Blue, ColorUtil.Cyan, ColorUtil.GreenYellow, ColorUtil.Yellow, ColorUtil.Red, ColorUtil.DarkRed },
new[] { 0, .1f, .3f, .5f, .7f, .9f, 1 }),
PaletteMinimum = new SCIVector3(0, 6, 0),
PaletteMaximum = new SCIVector3(0, 7, 0),
};
NOTE: See other constrained and unconstrained Free Surface Series types in the corresponding articles.