iOS & macOS Charting Documentation - SciChart iOS & macOS Charts SDK v4.x

PaletteProvider API

SciChart features a rich PaletteProvider API with gives the ability to change color on a point-by-point basis.

PaletteProvider API

NOTE: Examples of using PaletteProvider API can be found in the SciChart iOS Examples Suite as well as on GitHub:

To enable series coloring with PaletteProvider, you need to create a class which conforms to one of the following (or possibly to all of them):

A choice depends on a RenderableSeries type, which PaletteProvider is designed for.

Every PaletteProvider protocol declares the only property, which returns an array with colors for every data points. The -[ISCIPaletteProvider update] method is called every time a RenderableSeries requires a redraw, so it expects that the colors array should be updated there correspondingly.

For the convenience, there is also the SCIPaletteProviderBase class, which provides some basic implementation, so it’s recommended to inherit from it while implementing custom PaletteProviders.

Create Custom PaletteProvider

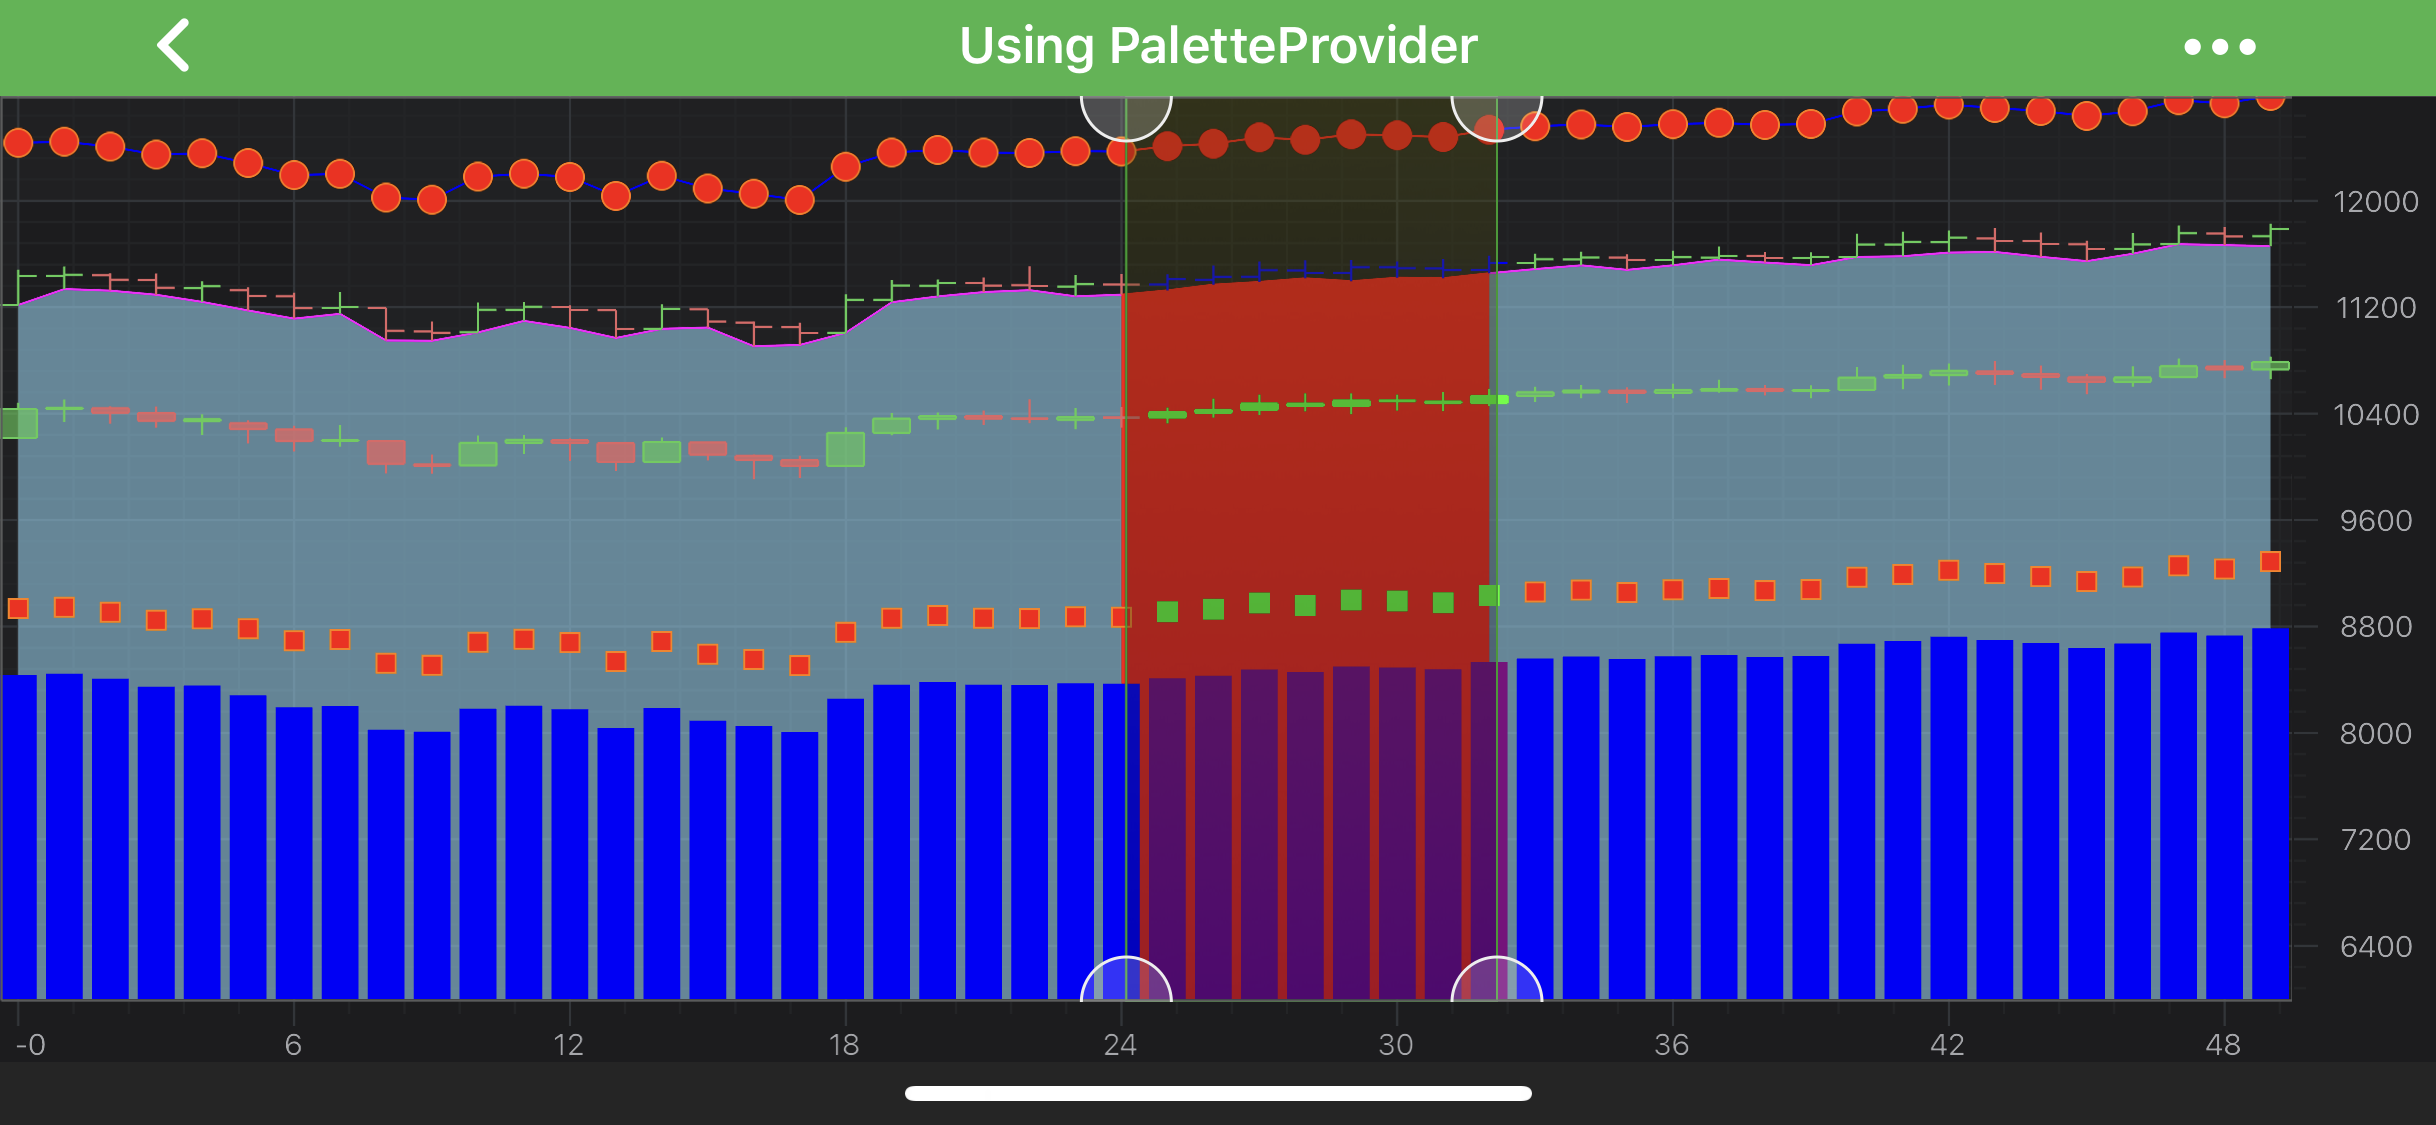
The following code snippet demonstrates how to create a custom PaletteProvider which conforms to all - Fill, Stroke, PointMarker - palette providers and potentially can be shared between multiple series.

NOTE: The below code is based on the Line Chart Example which can be found in the SciChart iOS Examples Suite as well as on GitHub

#import <SciChart/SCIPaletteProviderBase+Protected.h> @interface SharedPaletteProvider : SCIPaletteProviderBase<SCIXyRenderableSeriesBase *><ISCIStrokePaletteProvider, ISCIFillPaletteProvider, ISCIPointMarkerPaletteProvider> - (instancetype)initWithLowerLimit:(id<ISCIAnnotation>)lowerLimit upperLimit:(id<ISCIAnnotation>)upperLimit; @end @implementation SharedPaletteProvider { id<ISCIAnnotation> _lowerLimit; id<ISCIAnnotation> _upperLimit; } @synthesize strokeColors = _strokeColors; @synthesize fillColors = _fillColors; - (instancetype)initWithLowerLimit:(id<ISCIAnnotation>)lowerLimit upperLimit:(id<ISCIAnnotation>)upperLimit { self = [super initWithRenderableSeriesType:SCIXyRenderableSeriesBase.class]; if (self) { _strokeColors = [SCIUnsignedIntegerValues new]; _fillColors = [SCIUnsignedIntegerValues new]; _lowerLimit = lowerLimit; _upperLimit = upperLimit; } return self; } - (SCIUnsignedIntegerValues *)pointMarkerColors { return _fillColors; } - (void)update { double y1 = _lowerLimit.y1.toDouble; double y2 = _upperLimit.y1.toDouble; double minimum = MIN(y1, y2); double maximum = MAX(y1, y2); SCIXyRenderPassData *renderPassData = (SCIXyRenderPassData *)self.renderableSeries.currentRenderPassData; NSInteger count = renderPassData.pointsCount; _strokeColors.count = count; _fillColors.count = count; SCIDoubleValues *yValues = renderPassData.yValues; for (NSInteger i = 0; i < count; i++) { double value = [yValues getValueAt:i]; if (value > maximum) { [_strokeColors set:0xffff0000 at:i]; [_fillColors set:0x99ff0000 at:i]; } else if (value < minimum) { [_strokeColors set:0xff00ff00 at:i]; [_fillColors set:0x9900ff00 at:i]; } else { [_strokeColors set:0xffffff00 at:i]; [_fillColors set:0x99ffff00 at:i]; } } } @end
import SciChart.Protected.SCIPaletteProviderBase class SharedPaletteProvider: SCIPaletteProviderBase<SCIXyRenderableSeriesBase>, ISCIStrokePaletteProvider, ISCIFillPaletteProvider, ISCIPointMarkerPaletteProvider { let strokeColors = SCIUnsignedIntegerValues() let fillColors = SCIUnsignedIntegerValues() var pointMarkerColors: SCIUnsignedIntegerValues! { return fillColors } let lowerLimit: ISCIAnnotation let upperLimit: ISCIAnnotation init(lowerLimit: ISCIAnnotation, upperLimit: ISCIAnnotation) { self.lowerLimit = lowerLimit self.upperLimit = upperLimit super.init(renderableSeriesType: SCIXyRenderableSeriesBase.self) } override func update() { let y1: Double = lowerLimit.getY1() let y2: Double = upperLimit.getY1() let minimum = min(y1, y2) let maximum = max(y1, y2) let renderPassData = renderableSeries.currentRenderPassData as! SCIXyRenderPassData let count = renderPassData.pointsCount strokeColors.count = count fillColors.count = count let yValues = renderPassData.yValues! for i in 0 ..< count { let value = yValues.getValueAt(i) if (value > maximum) { strokeColors.set(0xffff0000, at: i) fillColors.set(0x99ff0000, at: i) } else if (value < minimum) { strokeColors.set(0xff00ff00, at: i) fillColors.set(0x9900ff00, at: i) } else { strokeColors.set(0xffffff00, at: i) fillColors.set(0x99ffff00, at: i) } } } }
class SharedPaletteProvider : SCIPaletteProviderBase<SCIXyRenderableSeriesBase>, IISCIStrokePaletteProvider, IISCIFillPaletteProvider, IISCIPointMarkerPaletteProvider { public SCIUnsignedIntegerValues StrokeColors { get; } = new SCIUnsignedIntegerValues(); public SCIUnsignedIntegerValues FillColors { get; } = new SCIUnsignedIntegerValues(); public SCIUnsignedIntegerValues PointMarkerColors { get { return FillColors; } } private SCIAnnotationBase lowerLimit; private SCIAnnotationBase upperLimit; public SharedPaletteProvider(SCIAnnotationBase lowerLimit, SCIAnnotationBase upperLimit) { this.lowerLimit = lowerLimit; this.upperLimit = upperLimit; } public override void Update() { var y1 = (double)lowerLimit.Y1Value; var y2 = (double)upperLimit.Y1Value; var minimum = Math.Min(y1, y2); var maximum = Math.Max(y1, y2); var renderPassData = (SCIXyRenderPassData)RenderableSeries.CurrentRenderPassData; var count = renderPassData.PointsCount; StrokeColors.Count = count; FillColors.Count = count; var yValues = renderPassData.YValues; for (var i = 0; i < count; i++) { var value = yValues.GetValueAt(i); if (value > maximum) { StrokeColors.Set(0xffff0000, i); FillColors.Set(0x99ff0000, i); } else if (value < minimum) { StrokeColors.Set(0xff00ff00, i); FillColors.Set(0x9900ff00, i); } else { StrokeColors.Set(0xffffff00, i); FillColors.Set(0x99ffff00, i); } } } }

Once a PaletteProvider class is ready, its instances can be used to set it for a RenderableSeries via the ISCIRenderableSeries.paletteProvider property:

id<ISCIAxis> xAxis = [SCINumericAxis new]; xAxis.growBy = [[SCIDoubleRange alloc] initWithMin:0.1 max:0.1]; id<ISCIAxis> yAxis = [SCINumericAxis new]; yAxis.growBy = [[SCIDoubleRange alloc] initWithMin:0.1 max:0.1]; SCIHorizontalLineAnnotation *upperLimit = [SCIHorizontalLineAnnotation new]; upperLimit.isEditable = YES; upperLimit.stroke = [[SCISolidPenStyle alloc] initWithColor:UIColor.redColor thickness:2]; upperLimit.y1 = @(2.7); SCIHorizontalLineAnnotation *lowerLimit = [SCIHorizontalLineAnnotation new]; lowerLimit.isEditable = YES; lowerLimit.stroke = [[SCISolidPenStyle alloc] initWithColor:UIColor.greenColor thickness:2]; lowerLimit.y1 = @(2.5); SCDDoubleSeries *data1 = [SCDDataManager getFourierSeriesWithAmplitude:1.0 phaseShift:0.1 xStart:5.02 xEnd:5.4 count:5000]; SCDDoubleSeries *data2 = [SCDDataManager getFourierSeriesWithAmplitude:1.0 phaseShift:0.1 xStart:6.02 xEnd:6.4 count:5000]; SCDDoubleSeries *data3 = [SCDDataManager getFourierSeriesWithAmplitude:1.0 phaseShift:0.1 xStart:7.02 xEnd:7.4 count:5000]; SCIXyDataSeries *dataSeries1 = [[SCIXyDataSeries alloc] initWithXType:SCIDataType_Double yType:SCIDataType_Double]; SCIXyDataSeries *dataSeries2 = [[SCIXyDataSeries alloc] initWithXType:SCIDataType_Double yType:SCIDataType_Double]; SCIXyDataSeries *dataSeries3 = [[SCIXyDataSeries alloc] initWithXType:SCIDataType_Double yType:SCIDataType_Double]; [dataSeries1 appendValuesX:data1.xValues y:data1.yValues]; [dataSeries2 appendValuesX:data2.xValues y:data2.yValues]; [dataSeries3 appendValuesX:data3.xValues y:data3.yValues]; SharedPaletteProvider *sharedPaletteProvider = [[SharedPaletteProvider alloc] initWithLowerLimit:lowerLimit upperLimit:upperLimit]; SCIFastLineRenderableSeries *lineSeries = [SCIFastLineRenderableSeries new]; lineSeries.paletteProvider = sharedPaletteProvider; lineSeries.dataSeries = dataSeries1; lineSeries.strokeStyle = [[SCISolidPenStyle alloc] initWithColorCode:0xFF279B27 thickness:1]; SCIEllipsePointMarker *marker = [SCIEllipsePointMarker new]; marker.size = CGSizeMake(20, 20); marker.strokeStyle = [[SCISolidPenStyle alloc] initWithColor:UIColor.systemBlueColor thickness:3]; marker.fillStyle = [[SCISolidBrushStyle alloc] initWithColor:UIColor.blueColor]; SCIXyScatterRenderableSeries *scatterSeries = [SCIXyScatterRenderableSeries new]; scatterSeries.pointMarker = marker; scatterSeries.paletteProvider = sharedPaletteProvider; scatterSeries.dataSeries = dataSeries2; scatterSeries.strokeStyle = [[SCISolidPenStyle alloc] initWithColorCode:0xFF279B27 thickness:1]; SCIFastMountainRenderableSeries *mountainSeries = [SCIFastMountainRenderableSeries new]; mountainSeries.paletteProvider = sharedPaletteProvider; mountainSeries.dataSeries = dataSeries3; mountainSeries.strokeStyle = [[SCISolidPenStyle alloc] initWithColorCode:0xFF279B27 thickness:1]; [SCIUpdateSuspender usingWithSuspendable:self.surface withBlock:^{ [self.surface.xAxes add:xAxis]; [self.surface.yAxes add:yAxis]; [self.surface.renderableSeries addAll:lineSeries, scatterSeries, mountainSeries, nil]; [self.surface.chartModifiers add:ExampleViewBase.createDefaultModifiers]; [self.surface.annotations addAll:lowerLimit, upperLimit, nil]; }];
let xAxis = SCINumericAxis() xAxis.growBy = SCIDoubleRange(min: 0.1, max: 0.1) let yAxis = SCINumericAxis() yAxis.growBy = SCIDoubleRange(min: 0.1, max: 0.1) let upperLimit = SCIHorizontalLineAnnotation() upperLimit.isEditable = true upperLimit.stroke = SCISolidPenStyle(color: .red, thickness: 2) upperLimit.set(y1: 2.7) let lowerLimit = SCIHorizontalLineAnnotation() lowerLimit.isEditable = true lowerLimit.stroke = SCISolidPenStyle(color: .green, thickness: 2) lowerLimit.set(y1: 2.5) let data1 = SCDDataManager.getFourierSeries(withAmplitude: 1.0, phaseShift: 0.1, xStart: 5.02, xEnd: 5.4, count: 5000) let data2 = SCDDataManager.getFourierSeries(withAmplitude: 1.0, phaseShift: 0.1, xStart: 6.02, xEnd: 6.4, count: 5000) let data3 = SCDDataManager.getFourierSeries(withAmplitude: 1.0, phaseShift: 0.1, xStart: 7.02, xEnd: 7.4, count: 5000) let dataSeries1 = SCIXyDataSeries(xType: .double, yType: .double) let dataSeries2 = SCIXyDataSeries(xType: .double, yType: .double) let dataSeries3 = SCIXyDataSeries(xType: .double, yType: .double) dataSeries1.append(x: data1.xValues, y: data1.yValues) dataSeries2.append(x: data2.xValues, y: data2.yValues) dataSeries3.append(x: data3.xValues, y: data3.yValues) let sharedPaletteProvider = SharedPaletteProvider(lowerLimit: lowerLimit, upperLimit: upperLimit) let lineSeries = SCIFastLineRenderableSeries() lineSeries.paletteProvider = sharedPaletteProvider lineSeries.dataSeries = dataSeries1 lineSeries.strokeStyle = SCISolidPenStyle(colorCode: 0xFF279B27, thickness: 1.0) let marker = SCIEllipsePointMarker() marker.size = CGSize(width: 20, height: 20) marker.strokeStyle = SCISolidPenStyle(color: .systemBlue, thickness: 3) marker.fillStyle = SCISolidBrushStyle(color: .blue) let scatterSeries = SCIXyScatterRenderableSeries() scatterSeries.pointMarker = marker scatterSeries.paletteProvider = sharedPaletteProvider scatterSeries.dataSeries = dataSeries2 scatterSeries.strokeStyle = SCISolidPenStyle(colorCode: 0xFF279B27, thickness: 1.0) let mountainSeries = SCIFastMountainRenderableSeries() mountainSeries.paletteProvider = sharedPaletteProvider mountainSeries.dataSeries = dataSeries3 mountainSeries.strokeStyle = SCISolidPenStyle(colorCode: 0xFF279B27, thickness: 1.0) SCIUpdateSuspender.usingWith(surface) { self.surface.xAxes.add(xAxis) self.surface.yAxes.add(yAxis) self.surface.renderableSeries.add(items: lineSeries, scatterSeries, mountainSeries) self.surface.chartModifiers.add(ExampleViewBase.createDefaultModifiers()) self.surface.annotations.add(items: lowerLimit, upperLimit) }
var xAxis = new SCINumericAxis { GrowBy = new SCIDoubleRange(0.1, 0.1) }; var yAxis = new SCINumericAxis { GrowBy = new SCIDoubleRange(0.1, 0.1) }; var upperLimit = new SCIHorizontalLineAnnotation { IsEditable = true, Stroke = new SCISolidPenStyle(0xffff0000, 2), Y1Value = 2.7 }; var lowerLimit = new SCIHorizontalLineAnnotation { IsEditable = true, Stroke = new SCISolidPenStyle(0xff00ff00, 2), Y1Value = 2.5 }; var data1 = DataManager.Instance.GetFourierSeries(1.0, 0.1, 5.02, 5.4); var data2 = DataManager.Instance.GetFourierSeries(1.0, 0.1, 6.02, 6.4); var data3 = DataManager.Instance.GetFourierSeries(1.0, 0.1, 7.02, 7.4); var dataSeries1 = new XyDataSeries(); var dataSeries2 = new XyDataSeries(); var dataSeries3 = new XyDataSeries(); dataSeries1.Append(data1.XData, data1.YData); dataSeries2.Append(data2.XData, data2.YData); dataSeries3.Append(data3.XData, data3.YData); var sharedPaletteProvider = new SharedPaletteProvider(lowerLimit, upperLimit); var lineSeries = new SCIFastLineRenderableSeries { DataSeries = dataSeries2, PaletteProvider = sharedPaletteProvider, StrokeStyle = new SCISolidPenStyle(0xFF279B27, 2f) }; var scatterSeries = new SCIXyScatterRenderableSeries { DataSeries = dataSeries1, PointMarker = new SCIEllipsePointMarker { Size = new CGSize(20, 20), StrokeStyle = new SCISolidPenStyle(UIColor.Blue, 3), FillStyle = new SCISolidBrushStyle(UIColor.Blue), }, PaletteProvider = sharedPaletteProvider, StrokeStyle = new SCISolidPenStyle(0xFF279B27, 2f) }; var mountainSeries = new SCIFastMountainRenderableSeries { DataSeries = dataSeries3, PaletteProvider = sharedPaletteProvider, StrokeStyle = new SCISolidPenStyle(0xFF279B27, 2f) }; using (Surface.SuspendUpdates()) { Surface.XAxes.Add(xAxis); Surface.YAxes.Add(yAxis); Surface.RenderableSeries.Add(lineSeries); Surface.RenderableSeries.Add(scatterSeries); Surface.RenderableSeries.Add(mountainSeries); Surface.ChartModifiers.Add(CreateDefaultModifiers()); Surface.Annotations.Add(lowerLimit); Surface.Annotations.Add(upperLimit); }

The code above results in a chart with renderableSeries listed below:

These charts are changing colors depending on the threshold levels provided by two Horizontal Line Annotations:

NOTE: The SCDDataManager is just a class, that provides stub data for Example Suite