SciChart® the market leader in Fast WPF Charts, WPF 3D Charts, iOS Chart, Android Chart and JavaScript Chart Components
Please note! These examples are new to SciChart iOS v4 release! SciChart’s OpenGL ES and Metal iOS and Metal macOS Chart library ships with hundred of Objective-C and Swift iOS&macOS Chart Examples which you can browse, play with and view the source-code. All of this is possible with the new and improved SciChart iOS Examples Suite and demo application for Mac, which ships as part of the SciChart SDK.
The PaletteProvider API allows you to individually style points, line segments, columns and candles based on data-values.
For example, if you wished to have a candlestick a different colour based on high volume condition, you can do this using the PaletteProvider API. Or, if you wanted to have scatter points or line segments turn red if they exceed a threshold, you can also do this with this powerful and flexible API.
Palette Providers can be enabled by creating a class which implements ISCIPaletteProvider and attaching to the SCIRenderableSeries.PaletteProvider property.
Implement the SCIPaletteProviderProtocol.styleForXy function and return a valid style for points you want to override. Returning nil uses the default (built in) series style.
The Swift and Objective-C source code for the iOS and macOS Use Palette Provider Example example is included below (Scroll down!).
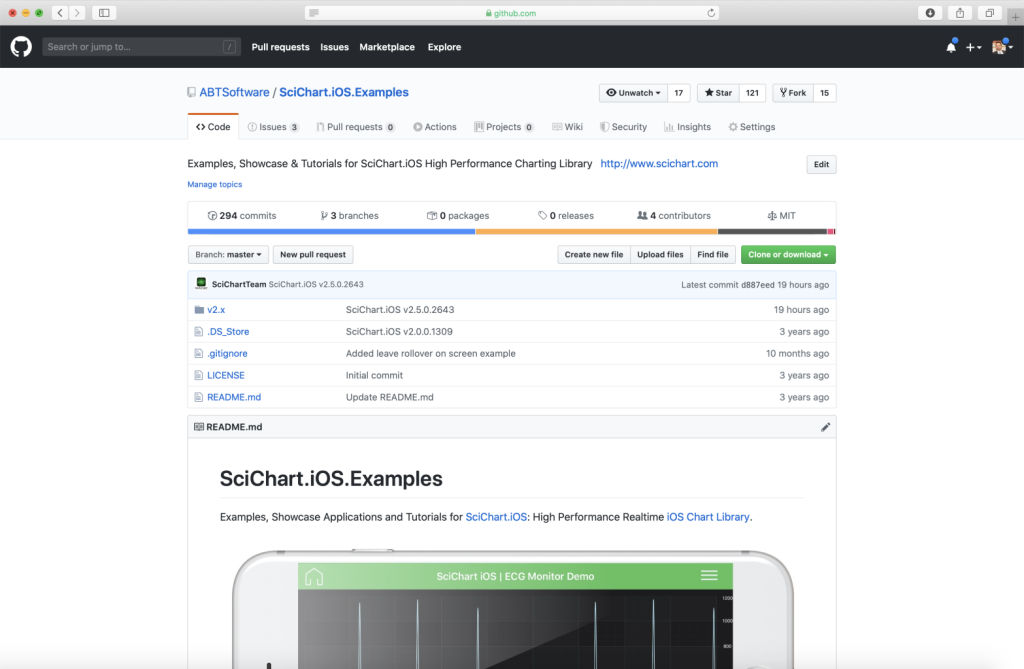
Did you know that we have the source code for all our example available for free on Github?
Clone the SciChart.iOS.Examples from Github.
Also the SciChart iOS and Scichart macOS Trials contain the full source for the examples (link below).
//******************************************************************************
// SCICHART® Copyright SciChart Ltd. 2011-2019. All rights reserved.
//
// Web: http://www.scichart.com
// Support: support@scichart.com
// Sales: sales@scichart.com
//
// UsePaletteProviderView.m is part of the SCICHART® Examples. Permission is hereby granted
// to modify, create derivative works, distribute and publish any part of this source
// code whether for commercial, private or personal use.
//
// The SCICHART® examples are distributed in the hope that they will be useful, but
// without any warranty. It is provided "AS IS" without warranty of any kind, either
// expressed or implied.
//******************************************************************************
#import "UsePaletteProviderView.h"
#import "SCDDataManager.h"
#import "XyCustomPaletteProvider.h"
#import "OhlcCustomPaletteProvider.h"
@interface AnnotationDragListener : NSObject<ISCIAnnotationDragListener>
@end
@implementation AnnotationDragListener
- (void)onDragStarted:(id<ISCIAnnotation>)annotation {
[self updateAnnotation:annotation];
}
- (void)onDragAnnotation:(id<ISCIAnnotation>)annotation byXDelta:(CGFloat)xDelta yDelta:(CGFloat)yDelta {
[self updateAnnotation:annotation];
}
- (void)onDragEnded:(id<ISCIAnnotation>)annotation {
[self updateAnnotation:annotation];
}
- (void)updateAnnotation:(id<ISCIAnnotation>)annotation {
annotation.y1 = @(0);
annotation.y2 = @(1);
}
@end
@implementation UsePaletteProviderView
- (Class)associatedType { return SCIChartSurface.class; }
- (BOOL)showDefaultModifiersInToolbar { return NO; }
- (void)initExample {
id<ISCIAxis> xAxis = [SCINumericAxis new];
xAxis.visibleRange = [[SCIDoubleRange alloc] initWithMin:150.0 max:165.0];
id<ISCIAxis> yAxis = [SCINumericAxis new];
SCDPriceSeries *priceData = [SCDDataManager getPriceDataIndu];
double offset = -1000;
SCIXyDataSeries *mountainDataSeries = [[SCIXyDataSeries alloc] initWithXType:SCIDataType_Double yType:SCIDataType_Double];
SCIXyDataSeries *lineDataSeries = [[SCIXyDataSeries alloc] initWithXType:SCIDataType_Double yType:SCIDataType_Double];
SCIXyDataSeries *columnDataSeries = [[SCIXyDataSeries alloc] initWithXType:SCIDataType_Double yType:SCIDataType_Double];
SCIOhlcDataSeries *ohlcDataSeries = [[SCIOhlcDataSeries alloc] initWithXType:SCIDataType_Double yType:SCIDataType_Double];
SCIOhlcDataSeries *candlestickDataSeries = [[SCIOhlcDataSeries alloc] initWithXType:SCIDataType_Double yType:SCIDataType_Double];
SCIXyDataSeries *scatterDataSeries = [[SCIXyDataSeries alloc] initWithXType:SCIDataType_Double yType:SCIDataType_Double];
[mountainDataSeries appendValuesX:priceData.indexesAsDouble y:priceData.lowData];
[lineDataSeries appendValuesX:priceData.indexesAsDouble y:[SCDDataManager offset:priceData.closeData offset:-offset]];
[columnDataSeries appendValuesX:priceData.indexesAsDouble y:[SCDDataManager offset:priceData.closeData offset:offset * 3]];
[ohlcDataSeries appendValuesX:priceData.indexesAsDouble open:priceData.openData high:priceData.highData low:priceData.lowData close:priceData.closeData];
[candlestickDataSeries appendValuesX:priceData.indexesAsDouble
open:[SCDDataManager offset:priceData.openData offset:offset]
high:[SCDDataManager offset:priceData.highData offset:offset]
low:[SCDDataManager offset:priceData.lowData offset:offset]
close:[SCDDataManager offset:priceData.closeData offset:offset]];
[scatterDataSeries appendValuesX:priceData.indexesAsDouble y:[SCDDataManager offset:priceData.closeData offset:offset * 2.5]];
SCIBoxAnnotation *boxAnnotation = [SCIBoxAnnotation new];
boxAnnotation.x1 = @(152);
boxAnnotation.y1 = @(1.0);
boxAnnotation.x2 = @(158);
boxAnnotation.y2 = @(0.0);
boxAnnotation.coordinateMode = SCIAnnotationCoordinateMode_RelativeY;
boxAnnotation.isEditable = YES;
boxAnnotation.fillBrush = [[SCILinearGradientBrushStyle alloc] initWithStart:CGPointZero end:CGPointMake(0, 1) startColorCode:0x550000FF endColorCode:0x55FFFF00];
boxAnnotation.borderPen = [[SCISolidPenStyle alloc] initWithColorCode:0xFF279B27 thickness:1.0];
boxAnnotation.annotationDragListener = [AnnotationDragListener new];
SCIFastMountainRenderableSeries *mountainSeries = [SCIFastMountainRenderableSeries new];
mountainSeries.dataSeries = mountainDataSeries;
mountainSeries.areaStyle = [[SCISolidBrushStyle alloc] initWithColorCode:0x9787CEEB];
mountainSeries.strokeStyle = [[SCISolidPenStyle alloc] initWithColorCode:0xFFFF00FF thickness:1.0];
mountainSeries.zeroLineY = 6000;
mountainSeries.paletteProvider = [[XyCustomPaletteProvider alloc] initWithColor:SCIColor.redColor annotation:boxAnnotation];
SCIEllipsePointMarker *ellipsePointMarker = [SCIEllipsePointMarker new];
ellipsePointMarker.fillStyle = [[SCISolidBrushStyle alloc] initWithColor:SCIColor.redColor];
ellipsePointMarker.strokeStyle = [[SCISolidPenStyle alloc] initWithColor:SCIColor.orangeColor thickness:2.0];
ellipsePointMarker.size = CGSizeMake(10, 10);
SCIFastLineRenderableSeries *lineSeries = [SCIFastLineRenderableSeries new];
lineSeries.dataSeries = lineDataSeries;
lineSeries.strokeStyle = [[SCISolidPenStyle alloc] initWithColorCode:0xFF0000FF thickness:1.0];
lineSeries.pointMarker = ellipsePointMarker;
lineSeries.paletteProvider = [[XyCustomPaletteProvider alloc] initWithColor:SCIColor.redColor annotation:boxAnnotation];
SCIFastOhlcRenderableSeries *ohlcSeries = [SCIFastOhlcRenderableSeries new];
ohlcSeries.dataSeries = ohlcDataSeries;
ohlcSeries.paletteProvider = [[OhlcCustomPaletteProvider alloc] initWithColor:SCIColor.blueColor annotation:boxAnnotation];
SCIFastCandlestickRenderableSeries *candlestickSeries = [SCIFastCandlestickRenderableSeries new];
candlestickSeries.dataSeries = candlestickDataSeries;
candlestickSeries.paletteProvider = [[OhlcCustomPaletteProvider alloc] initWithColor:SCIColor.greenColor annotation:boxAnnotation];
SCIFastColumnRenderableSeries *columnSeries = [SCIFastColumnRenderableSeries new];
columnSeries.dataSeries = columnDataSeries;
columnSeries.strokeStyle = [[SCISolidPenStyle alloc] initWithColor:SCIColor.blueColor thickness:1];
columnSeries.zeroLineY = 6000;
columnSeries.fillBrushStyle = [[SCISolidBrushStyle alloc] initWithColor:SCIColor.blueColor];
columnSeries.paletteProvider = [[XyCustomPaletteProvider alloc] initWithColor:SCIColor.purpleColor annotation:boxAnnotation];
SCISquarePointMarker *squarePointMarker = [SCISquarePointMarker new];
squarePointMarker.fillStyle = [[SCISolidBrushStyle alloc] initWithColor:SCIColor.redColor];
squarePointMarker.strokeStyle = [[SCISolidPenStyle alloc] initWithColor:SCIColor.orangeColor thickness:2.0];
squarePointMarker.size = CGSizeMake(7, 7);
SCIXyScatterRenderableSeries *scatterSeries = [SCIXyScatterRenderableSeries new];
scatterSeries.dataSeries = scatterDataSeries;
scatterSeries.pointMarker = squarePointMarker;
scatterSeries.paletteProvider = [[XyCustomPaletteProvider alloc] initWithColor:SCIColor.greenColor annotation:boxAnnotation];
[SCIUpdateSuspender usingWithSuspendable:self.surface withBlock:^{
[self.surface.xAxes add:xAxis];
[self.surface.yAxes add:yAxis];
[self.surface.renderableSeries addAll:mountainSeries, lineSeries, ohlcSeries, candlestickSeries, columnSeries, scatterSeries, nil];
[self.surface.chartModifiers add:[SCDExampleBaseViewController createDefaultModifiers]];
[self.surface.annotations add:boxAnnotation];
[SCIAnimations scaleSeries:mountainSeries withZeroLine:6000 duration:3.0 andEasingFunction:[SCIElasticEase new]];
[SCIAnimations scaleSeries:lineSeries withZeroLine:12500 duration:3.0 andEasingFunction:[SCIElasticEase new]];
[SCIAnimations scaleSeries:ohlcSeries withZeroLine:11750 duration:3.0 andEasingFunction:[SCIElasticEase new]];
[SCIAnimations scaleSeries:candlestickSeries withZeroLine:10750 duration:3.0 andEasingFunction:[SCIElasticEase new]];
[SCIAnimations scaleSeries:columnSeries withZeroLine:6000 duration:3.0 andEasingFunction:[SCIElasticEase new]];
[SCIAnimations scaleSeries:scatterSeries withZeroLine:9000 duration:3.0 andEasingFunction:[SCIElasticEase new]];
}];
}
@end
//******************************************************************************
// SCICHART® Copyright SciChart Ltd. 2011-2019. All rights reserved.
//
// Web: http://www.scichart.com
// Support: support@scichart.com
// Sales: sales@scichart.com
//
// XyCustomPaletteProvider.m is part of the SCICHART® Examples. Permission is hereby granted
// to modify, create derivative works, distribute and publish any part of this source
// code whether for commercial, private or personal use.
//
// The SCICHART® examples are distributed in the hope that they will be useful, but
// without any warranty. It is provided "AS IS" without warranty of any kind, either
// expressed or implied.
//******************************************************************************
#import "XyCustomPaletteProvider.h"
@implementation XyCustomPaletteProvider {
SCIUnsignedIntegerValues *_colors;
int _color;
SCIBoxAnnotation *_annotation;
}
- (instancetype)initWithColor:(SCIColor *)color annotation:(SCIBoxAnnotation *)annotation {
self = [super initWithRenderableSeriesType:SCIXyRenderableSeriesBase.class];
if (self) {
_colors = [SCIUnsignedIntegerValues new];
_color = color.colorARGBCode;
_annotation = annotation;
}
return self;
}
- (void)update {
SCIXyRenderableSeriesBase *rSeries = self.renderableSeries;
SCIXyRenderPassData *rpd = (SCIXyRenderPassData *)rSeries.currentRenderPassData;
SCIDoubleValues *xValues = rpd.xValues;
NSInteger count = rpd.pointsCount;
_colors.count = count;
double x1 = _annotation.x1.toDouble;
double x2 = _annotation.x2.toDouble;
double min = MIN(x1, x2);
double max = MAX(x1, x2);
unsigned int *colorsArray = _colors.itemsArray;
double *valuesArray = xValues.itemsArray;
for (int i = 0; i < count; i++) {
double value = valuesArray[i];
if (value > min && value < max) {
colorsArray[i] = _color;
} else {
colorsArray[i] = SCIPaletteProviderBase.defaultColor;
}
}
}
- (SCIUnsignedIntegerValues *)fillColors {
return _colors;
}
- (SCIUnsignedIntegerValues *)pointMarkerColors {
return _colors;
}
- (SCIUnsignedIntegerValues *)strokeColors {
return _colors;
}
@end
//******************************************************************************
// SCICHART® Copyright SciChart Ltd. 2011-2019. All rights reserved.
//
// Web: http://www.scichart.com
// Support: support@scichart.com
// Sales: sales@scichart.com
//
// UsePaletteProviderView.swift is part of the SCICHART® Examples. Permission is hereby granted
// to modify, create derivative works, distribute and publish any part of this source
// code whether for commercial, private or personal use.
//
// The SCICHART® examples are distributed in the hope that they will be useful, but
// without any warranty. It is provided "AS IS" without warranty of any kind, either
// expressed or implied.
//******************************************************************************
class AnnotationDragListener: ISCIAnnotationDragListener {
func onDragStarted(_ annotation: ISCIAnnotation) {
updateAnnotation(annotation: annotation)
}
func onDrag(_ annotation: ISCIAnnotation, byXDelta xDelta: CGFloat, yDelta: CGFloat) {
updateAnnotation(annotation: annotation)
}
func onDragEnded(_ annotation: ISCIAnnotation) {
updateAnnotation(annotation: annotation)
}
func updateAnnotation(annotation: ISCIAnnotation) {
annotation.set(y1: 0)
annotation.set(y2: 1)
}
}
class UsePaletteProviderView: SCDSingleChartViewController<SCIChartSurface> {
override var associatedType: AnyClass { return SCIChartSurface.self }
override var showDefaultModifiersInToolbar: Bool { return false }
override func initExample() {
let xAxis = SCINumericAxis()
xAxis.visibleRange = SCIDoubleRange(min: 150.0, max: 165.0)
let yAxis = SCINumericAxis()
yAxis.growBy = SCIDoubleRange(min: 0, max: 0.1)
yAxis.autoRange = .always
yAxis.labelProvider = SCDThousandsLabelProvider()
let priceData = SCDDataManager.getPriceDataIndu()
let offset = -1000.0
let mountainDataSeries = SCIXyDataSeries(xType: .double, yType: .double)
let lineDataSeries = SCIXyDataSeries(xType: .double, yType: .double)
let columnDataSeries = SCIXyDataSeries(xType: .double, yType: .double)
let ohlcDataSeries = SCIOhlcDataSeries(xType: .double, yType: .double)
let candlestickDataSeries = SCIOhlcDataSeries(xType: .double, yType: .double)
let scatterDataSeries = SCIXyDataSeries(xType: .double, yType: .double)
mountainDataSeries.append(x: priceData.indexesAsDouble, y: priceData.lowData)
lineDataSeries.append(x: priceData.indexesAsDouble, y: SCDDataManager.offset(priceData.closeData, offset: -offset))
columnDataSeries.append(x: priceData.indexesAsDouble, y: SCDDataManager.offset(priceData.closeData, offset: offset * 3))
ohlcDataSeries.append(x: priceData.indexesAsDouble, open:priceData.openData, high:priceData.highData, low:priceData.lowData, close:priceData.closeData)
candlestickDataSeries.append(x: priceData.indexesAsDouble,
open: SCDDataManager.offset(priceData.openData, offset: offset),
high: SCDDataManager.offset(priceData.highData, offset: offset),
low: SCDDataManager.offset(priceData.lowData, offset: offset),
close: SCDDataManager.offset(priceData.closeData, offset: offset))
scatterDataSeries.append(x: priceData.indexesAsDouble, y: SCDDataManager.offset(priceData.closeData, offset: offset * 2.5))
let boxAnnotation = SCIBoxAnnotation()
boxAnnotation.set(x1: 152.0)
boxAnnotation.set(y1: 1.0)
boxAnnotation.set(x2: 158.0)
boxAnnotation.set(y2: 0.0)
boxAnnotation.coordinateMode = .relativeY
boxAnnotation.isEditable = true
boxAnnotation.fillBrush = SCILinearGradientBrushStyle(start: CGPoint(x: 0.5, y: 0.0), end: CGPoint(x: 0.5, y: 1.0), startColor: 0x550000FF, endColor: 0x55FFFF00)
boxAnnotation.borderPen = SCISolidPenStyle(color: 0xFF279B27, thickness: 1)
boxAnnotation.annotationDragListener = AnnotationDragListener()
let mountainSeries = SCIFastMountainRenderableSeries()
mountainSeries.dataSeries = mountainDataSeries
mountainSeries.areaStyle = SCISolidBrushStyle(color: 0x9787CEEB)
mountainSeries.strokeStyle = SCISolidPenStyle(color: 0xFFFF00FF, thickness: 1.0)
mountainSeries.zeroLineY = 6000
mountainSeries.paletteProvider = XyCustomPaletteProvider(color: SCIColor.red, annotation: boxAnnotation)
let ellipsePointMarker = SCIEllipsePointMarker()
ellipsePointMarker.fillStyle = SCISolidBrushStyle(color: SCIColor.red)
ellipsePointMarker.strokeStyle = SCISolidPenStyle(color: SCIColor.orange, thickness: 2.0)
ellipsePointMarker.size = CGSize(width: 10, height: 10)
let lineSeries = SCIFastLineRenderableSeries()
lineSeries.dataSeries = lineDataSeries
lineSeries.strokeStyle = SCISolidPenStyle(color: 0xFF0000FF, thickness: 1.0)
lineSeries.pointMarker = ellipsePointMarker
lineSeries.paletteProvider = XyCustomPaletteProvider(color: SCIColor.red, annotation: boxAnnotation)
let ohlcSeries = SCIFastOhlcRenderableSeries()
ohlcSeries.dataSeries = ohlcDataSeries
ohlcSeries.paletteProvider = OhlcCustomPaletteProvider(color: SCIColor.blue, annotation: boxAnnotation)
let candlestickSeries = SCIFastCandlestickRenderableSeries()
candlestickSeries.dataSeries = candlestickDataSeries
candlestickSeries.paletteProvider = OhlcCustomPaletteProvider(color: SCIColor.green, annotation: boxAnnotation)
let columnSeries = SCIFastColumnRenderableSeries()
columnSeries.dataSeries = columnDataSeries
columnSeries.strokeStyle = SCISolidPenStyle(color: SCIColor.blue, thickness: 1)
columnSeries.zeroLineY = 6000
columnSeries.fillBrushStyle = SCISolidBrushStyle(color: SCIColor.blue)
columnSeries.paletteProvider = XyCustomPaletteProvider(color: SCIColor.purple, annotation: boxAnnotation)
let squarePointMarker = SCISquarePointMarker()
squarePointMarker.fillStyle = SCISolidBrushStyle(color: SCIColor.red)
squarePointMarker.strokeStyle = SCISolidPenStyle(color: SCIColor.orange, thickness: 2.0)
squarePointMarker.size = CGSize(width: 7, height: 7)
let scatterSeries = SCIXyScatterRenderableSeries()
scatterSeries.dataSeries = scatterDataSeries
scatterSeries.pointMarker = squarePointMarker
scatterSeries.paletteProvider = XyCustomPaletteProvider(color: SCIColor.green, annotation: boxAnnotation)
SCIUpdateSuspender.usingWith(surface) {
self.surface.xAxes.add(xAxis)
self.surface.yAxes.add(yAxis)
self.surface.renderableSeries.add(items: mountainSeries, lineSeries, ohlcSeries, candlestickSeries, columnSeries, scatterSeries)
self.surface.chartModifiers.add(SCDExampleBaseViewController.createDefaultModifiers())
self.surface.annotations.add(boxAnnotation)
SCIAnimations.scale(mountainSeries, withZeroLine: 6000, duration: 3.0, andEasingFunction: SCIElasticEase())
SCIAnimations.scale(lineSeries, withZeroLine: 12500, duration: 3.0, andEasingFunction: SCIElasticEase())
SCIAnimations.scale(ohlcSeries, withZeroLine: 11750, duration: 3.0, andEasingFunction: SCIElasticEase())
SCIAnimations.scale(candlestickSeries, withZeroLine: 10750, duration: 3.0, andEasingFunction: SCIElasticEase())
SCIAnimations.scale(columnSeries, withZeroLine: 6000, duration: 3.0, andEasingFunction: SCIElasticEase())
SCIAnimations.scale(scatterSeries, withZeroLine: 9000, duration: 3.0, andEasingFunction: SCIElasticEase())
}
}
}
//******************************************************************************
// SCICHART® Copyright SciChart Ltd. 2011-2019. All rights reserved.
//
// Web: http://www.scichart.com
// Support: support@scichart.com
// Sales: sales@scichart.com
//
// XyCustomPaletteProvider.swift is part of the SCICHART® Examples. Permission is hereby granted
// to modify, create derivative works, distribute and publish any part of this source
// code whether for commercial, private or personal use.
//
// The SCICHART® examples are distributed in the hope that they will be useful, but
// without any warranty. It is provided "AS IS" without warranty of any kind, either
// expressed or implied.
//******************************************************************************
class XyCustomPaletteProvider: SCIPaletteProviderBase<SCIXyRenderableSeriesBase>, ISCIFillPaletteProvider, ISCIStrokePaletteProvider, ISCIPointMarkerPaletteProvider {
let colors = SCIUnsignedIntegerValues()
let color: UInt32
let annotation: SCIBoxAnnotation
init(color: SCIColor, annotation: SCIBoxAnnotation) {
self.color = color.colorARGBCode()
self.annotation = annotation
super.init(renderableSeriesType: SCIXyRenderableSeriesBase.self)
}
override func update() {
let rSeries = renderableSeries
let rpd = rSeries?.currentRenderPassData as! SCIXyRenderPassData
let xValues = rpd.xValues
let count = rpd.pointsCount
colors.count = count
let x1: Double = annotation.getX1()
let x2: Double = annotation.getX2()
let minimum = min(x1, x2)
let maximum = max(x1, x2)
for i in 0 ..< count {
let value = xValues.getValueAt(i)
if (value > minimum && value < maximum) {
colors.set(color, at: i)
} else {
colors.set(SCIPaletteProviderBase<SCIXyRenderableSeriesBase>.defaultColor, at: i)
}
}
}
var fillColors: SCIUnsignedIntegerValues { return colors }
var pointMarkerColors: SCIUnsignedIntegerValues { return colors }
var strokeColors: SCIUnsignedIntegerValues { return colors }
}