iOS & macOS charts - Examples
Please note! These examples are new to SciChart iOS v4 release! SciChart’s OpenGL ES and Metal iOS and Metal macOS Chart library ships with hundred of Objective-C and Swift iOS & macOS Chart Examples which you can browse, play with and view the source-code. All of this is possible with the new and improved SciChart iOS Examples Suite and demo application for Mac, which ships as part of the SciChart SDK.
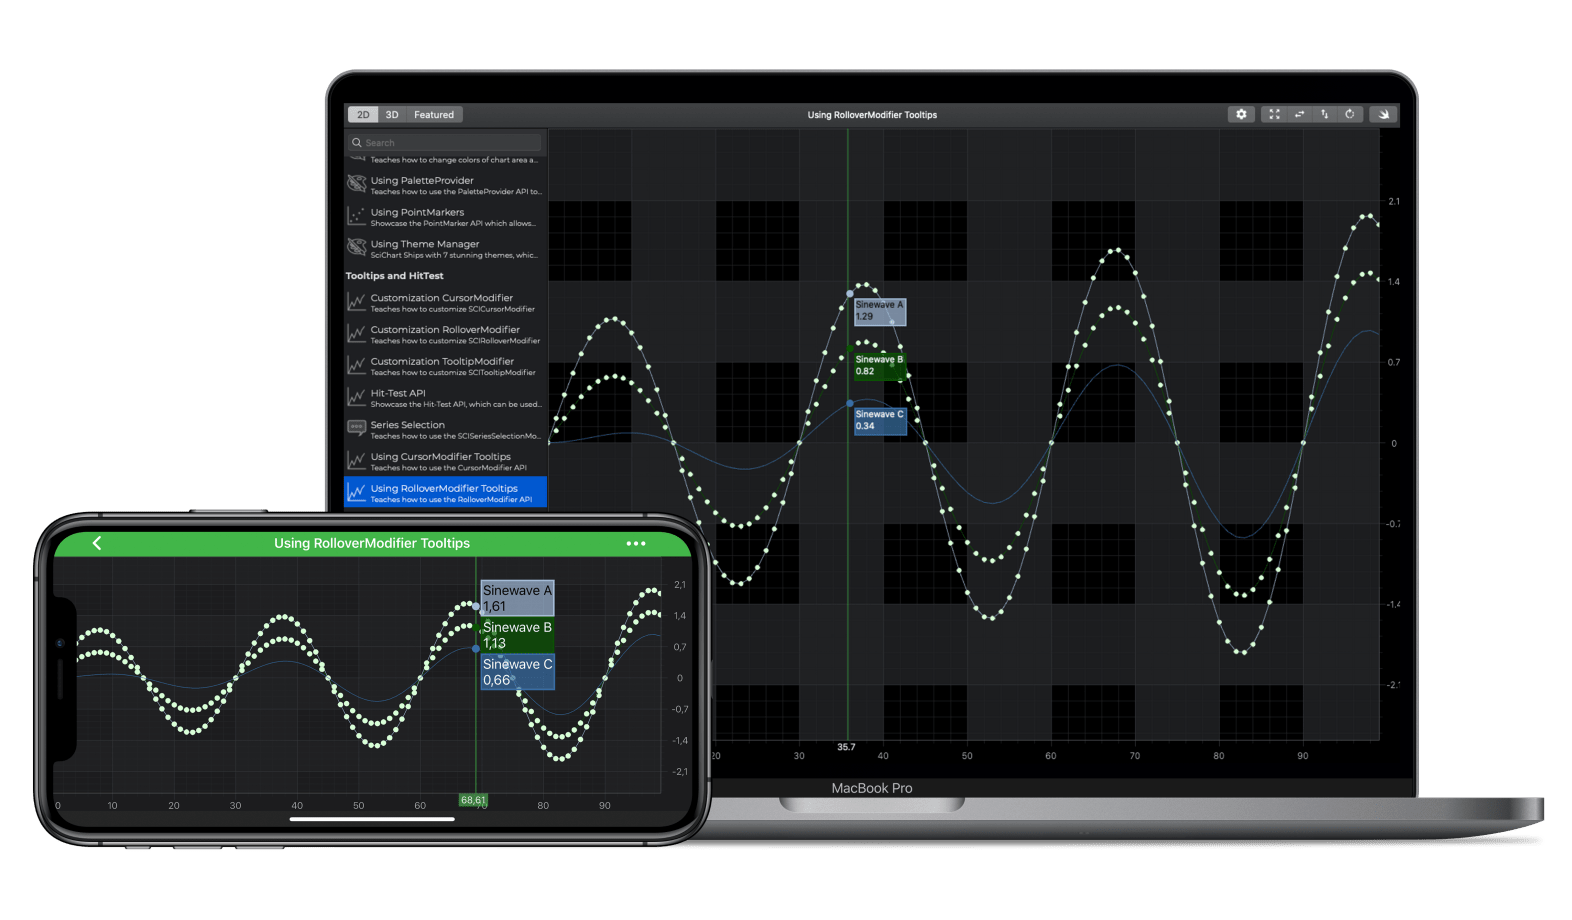
Tooltips may be added to an iOS Chart using the SCIRolloverModifier. This is a SCIChartModifierBase derived type which is attached to the SCIChartSurface.chartModifiers property.
The RolloverModifier provides a vertical line with small ellipse markers where the line intersects the series. Tooltips are displayed next to the marker locations. This tooltip type is particularly useful for stock charts, or for apps displaying a time series, where you need to know the values of many series on an iOS Chart at the same time.
NOTE: See documentation about the SCIRolloverModifier Type here.
The Swift and Objective-C source code for the iOS and macOS Chart with RolloverModifier Tooltips example is included below (Scroll down!).
Did you know that we have the source code for all our example available for free on Github?
Clone the SciChart.iOS.Examples from Github.
Also the SciChart iOS and Scichart macOS Trials contain the full source for the examples (link below).


