iOS & macOS charts - Examples
Please note! These examples are new to SciChart iOS v4 release! SciChart’s OpenGL ES and Metal iOS and Metal macOS Chart library ships with hundred of Objective-C and Swift iOS & macOS Chart Examples which you can browse, play with and view the source-code. All of this is possible with the new and improved SciChart iOS Examples Suite and demo application for Mac, which ships as part of the SciChart SDK.
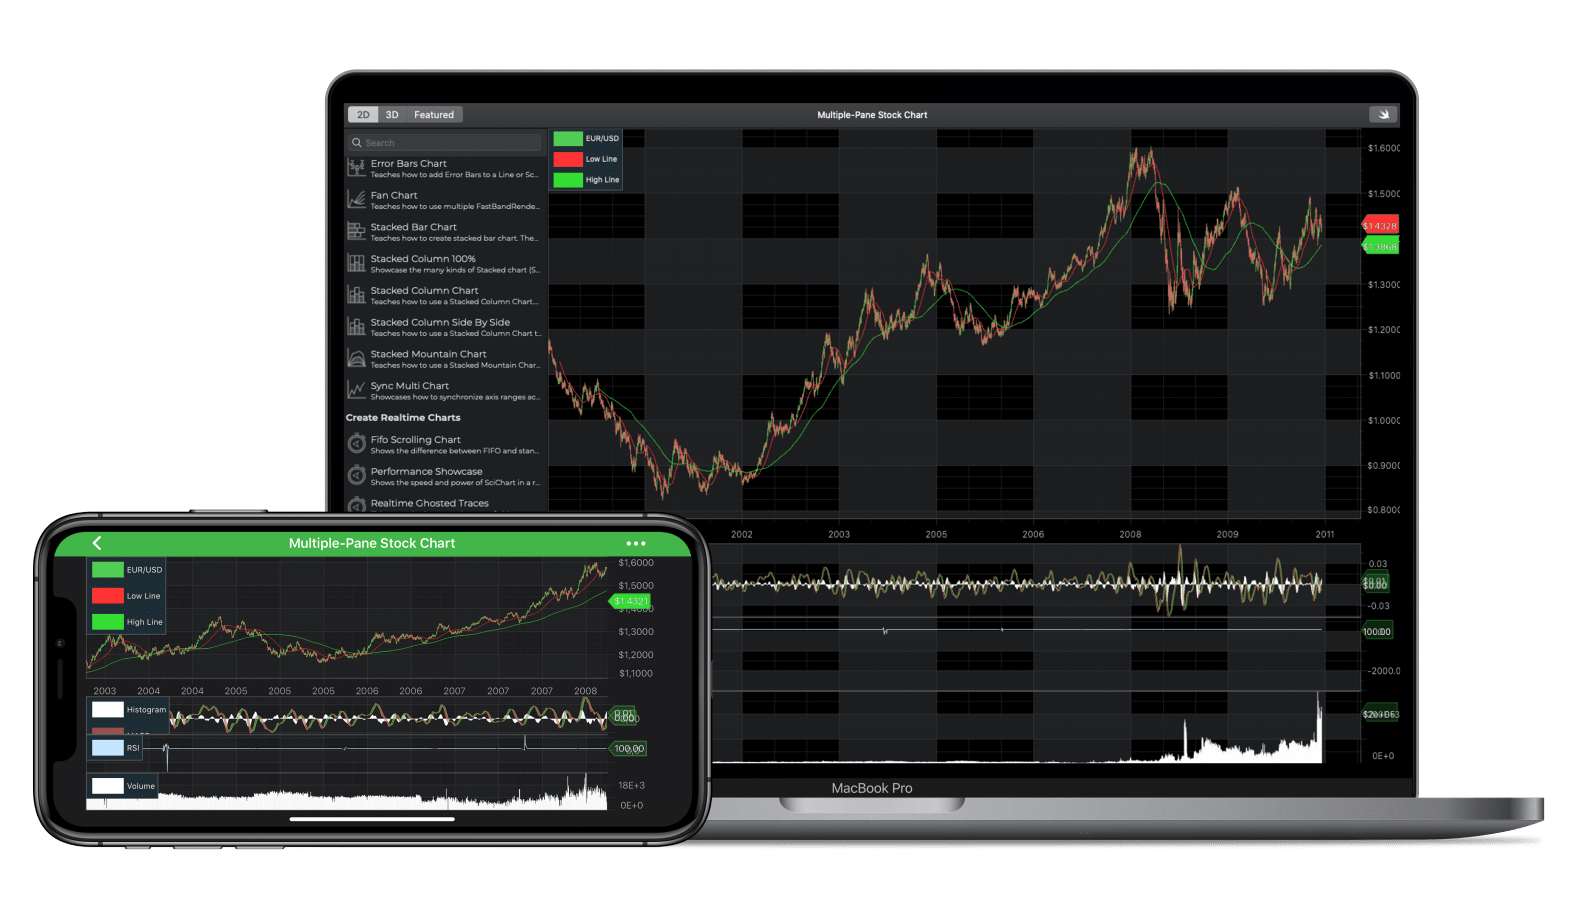
The iOS Create Multi Pane Stock Charts example demonstrates how SciChart iOS is suitable for creating complex, multi-panel stock chart and trading apps, able to display indicators on the main pane, in panels and synchronize the zooming, scrolling of multiple charts together.
An Ohlc or Candlestick chart is added by using SciChart’s SCIFastCandlestickRenderableSeries or SCIFastOhlcRenderableSeries respectively. Two line series using SCIFastLineRenderableSeries draw the moving averages.
Price data is updated in a SCIOhlcDataSeries in a timer callback. When the data updates, SciChart automatically redraws. Scrolling to the latest bar is handled in code by manipulating the Axis.VisibleRange property.
Technical Indicators are for demonstration purposes only. We recommend the open-source TA-Lib to integrate technical indicators to SciChart!
The Swift and Objective-C source code for the iOS and macOS Multi-Panel Stock Chartexample is included below (Scroll down!).
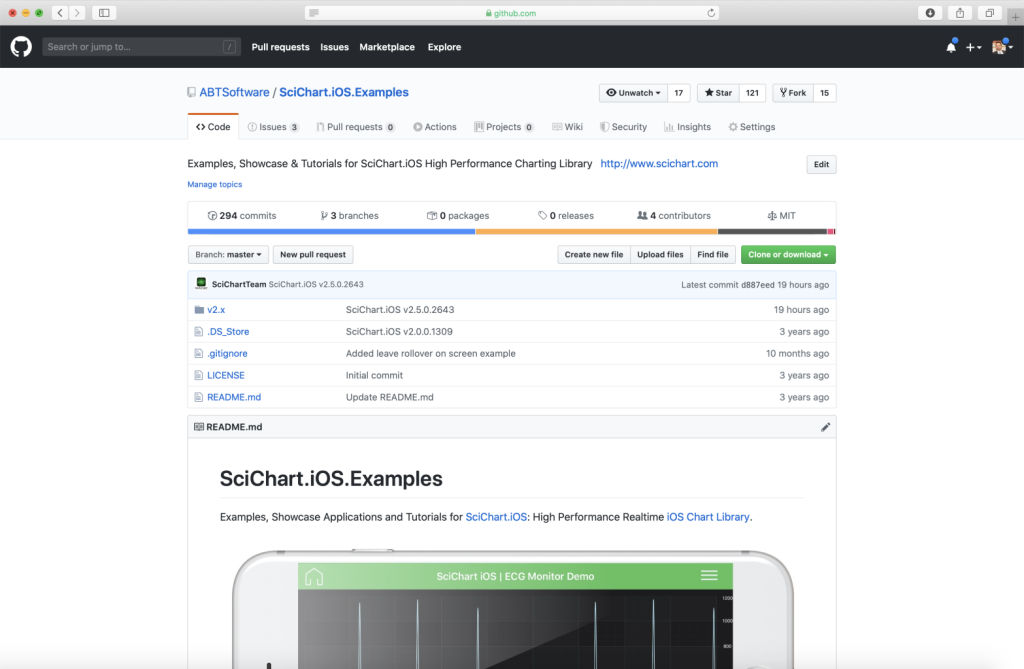
Did you know that we have the source code for all our example available for free on Github?
Clone the SciChart.iOS.Examples from Github.
Also the SciChart iOS and Scichart macOS Trials contain the full source for the examples (link below).


