SciChart® the market leader in Fast WPF Charts, WPF 3D Charts, iOS Chart, Android Chart and JavaScript Chart Components
Please note! These examples are new to SciChart iOS v4 release! SciChart’s OpenGL ES and Metal iOS and Metal macOS Chart library ships with hundred of Objective-C and Swift iOS&macOS Chart Examples which you can browse, play with and view the source-code. All of this is possible with the new and improved SciChart iOS Examples Suite and demo application for Mac, which ships as part of the SciChart SDK.
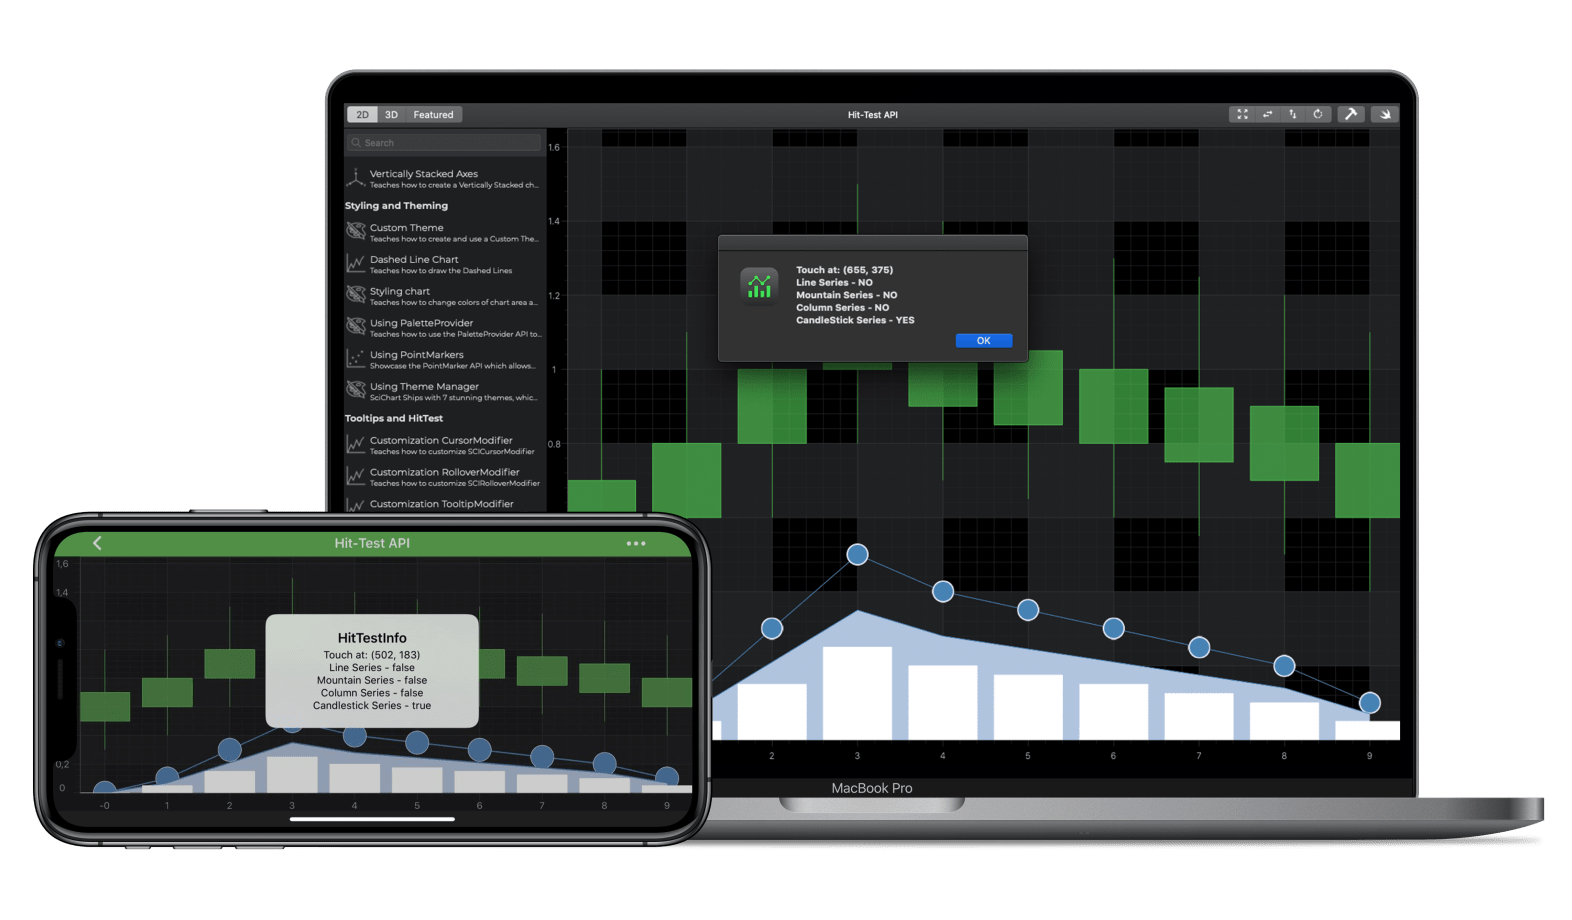
In SciChart iOS, it is possible to check if a line segment, point, candle, column or area has been tapped by the user. To do this, we use the Hit-Test API.
Each SCIRenderableSeriesBase type has a HitTestProvider. If you call Hit-Test on the provider passing in a screen coordinate (X,Y pixel coordinate), SciChart will return a SCIHitTestInfo instance containing information about the hit-test.
The Swift and Objective-C source code for the iOS and macOS Chart Hit Test API example is included below (Scroll down!).
Did you know that we have the source code for all our example available for free on Github?
Clone the SciChart.iOS.Examples from Github.
Also the SciChart iOS and Scichart macOS Trials contain the full source for the examples (link below).
//******************************************************************************
// SCICHART® Copyright SciChart Ltd. 2011-2019. All rights reserved.
//
// Web: http://www.scichart.com
// Support: support@scichart.com
// Sales: sales@scichart.com
//
// HitTestAPIChart.m is part of the SCICHART® Examples. Permission is hereby granted
// to modify, create derivative works, distribute and publish any part of this source
// code whether for commercial, private or personal use.
//
// The SCICHART® examples are distributed in the hope that they will be useful, but
// without any warranty. It is provided "AS IS" without warranty of any kind, either
// expressed or implied.
//******************************************************************************
#import "HitTestAPIChart.h"
#import "SCDDataManager.h"
#import "SCDAlertPresenter.h"
@implementation HitTestAPIChart {
SCIHitTestInfo *_hitTestInfo;
SCDAlertPresenter * _alertPresenter;
}
- (Class)associatedType { return SCIChartSurface.class; }
- (void)commonInit {
_hitTestInfo = [SCIHitTestInfo new];
[self.surface addGestureRecognizer:[[SCITapGestureRecognizer alloc] initWithTarget:self action:@selector(handleSingleTap:)]];
}
- (void)initExample {
id<ISCIAxis> xAxis = [SCINumericAxis new];
id<ISCIAxis> yAxis = [SCINumericAxis new];
yAxis.axisAlignment = SCIAxisAlignment_Left;
yAxis.growBy = [[SCIDoubleRange alloc] initWithMin:0 max:0.1];
double xData[] = {0, 1, 2, 3, 4, 5, 6, 7, 8, 9};
double yData[] = {0, 0.1, 0.3, 0.5, 0.4, 0.35, 0.3, 0.25, 0.2, 0.1};
SCIDoubleValues *xValues = [[SCIDoubleValues alloc] initWithItems:xData count:10];
SCIDoubleValues *yValues = [[SCIDoubleValues alloc] initWithItems:yData count:10];
SCIXyDataSeries *dataSeries0 = [[SCIXyDataSeries alloc] initWithXType:SCIDataType_Double yType:SCIDataType_Double];
dataSeries0.seriesName = @"Line Series";
[dataSeries0 appendValuesX:xValues y:yValues];
SCIXyDataSeries *dataSeries1 = [[SCIXyDataSeries alloc] initWithXType:SCIDataType_Double yType:SCIDataType_Double];
dataSeries1.seriesName = @"Mountain Series";
[dataSeries1 appendValuesX:xValues y:[SCDDataManager scaleValues:yValues scale:0.7]];
SCIXyDataSeries *dataSeries2 = [[SCIXyDataSeries alloc] initWithXType:SCIDataType_Double yType:SCIDataType_Double];
dataSeries2.seriesName = @"Column Series";
[dataSeries2 appendValuesX:xValues y:[SCDDataManager scaleValues:yValues scale:0.5]];
SCIOhlcDataSeries *dataSeries3 = [[SCIOhlcDataSeries alloc] initWithXType:SCIDataType_Double yType:SCIDataType_Double];
dataSeries3.seriesName = @"CandleStick Series";
[dataSeries3 appendValuesX:xValues open:[SCDDataManager offset:yValues offset:0.5] high:[SCDDataManager offset:yValues offset:1] low:[SCDDataManager offset:yValues offset:0.3] close:[SCDDataManager offset:yValues offset:0.7]];
SCIEllipsePointMarker *pointMarker = [SCIEllipsePointMarker new];
pointMarker.size = CGSizeMake(30, 30);
pointMarker.fillStyle = [[SCISolidBrushStyle alloc] initWithColorCode:0xFF4682B4];
pointMarker.strokeStyle = [[SCISolidPenStyle alloc] initWithColorCode:0xFFE6E6FA thickness:2];
SCIFastLineRenderableSeries *lineSeries = [SCIFastLineRenderableSeries new];
lineSeries.dataSeries = dataSeries0;
lineSeries.strokeStyle = [[SCISolidPenStyle alloc] initWithColorCode:0xFF4682B4 thickness:2];
lineSeries.pointMarker = pointMarker;
SCIFastMountainRenderableSeries *mountainSeries = [SCIFastMountainRenderableSeries new];
mountainSeries.dataSeries = dataSeries1;
mountainSeries.areaStyle = [[SCISolidBrushStyle alloc] initWithColorCode:0xFFB0C4DE];
mountainSeries.strokeStyle = [[SCISolidPenStyle alloc] initWithColorCode:0xFF4682B4 thickness:2];
SCIFastColumnRenderableSeries *columnSeries = [SCIFastColumnRenderableSeries new];
columnSeries.dataSeries = dataSeries2;
SCIFastCandlestickRenderableSeries *candlestickSeries = [SCIFastCandlestickRenderableSeries new];
candlestickSeries.dataSeries = dataSeries3;
[SCIUpdateSuspender usingWithSuspendable:self.surface withBlock:^{
[self.surface.xAxes add:xAxis];
[self.surface.yAxes add:yAxis];
[self.surface.renderableSeries add:lineSeries];
[self.surface.renderableSeries add:mountainSeries];
[self.surface.renderableSeries add:columnSeries];
[self.surface.renderableSeries add:candlestickSeries];
[SCIAnimations scaleSeries:lineSeries duration:1.5 andEasingFunction:[SCICubicEase new]];
[SCIAnimations scaleSeries:mountainSeries duration:1.5 andEasingFunction:[SCICubicEase new]];
[SCIAnimations scaleSeries:columnSeries duration:1.5 andEasingFunction:[SCICubicEase new]];
[SCIAnimations scaleSeries:candlestickSeries duration:1.5 andEasingFunction:[SCICubicEase new]];
}];
}
- (void)handleSingleTap:(SCITapGestureRecognizer *)recognizer {
CGPoint location = [recognizer locationInView:recognizer.view];
CGPoint hitTestPoint = [self.surface translatePoint:location hitTestable:self.surface.renderableSeriesArea];
NSMutableString *resultString = [NSMutableString stringWithFormat:@"Touch at: (%.0f, %.0f)", hitTestPoint.x, hitTestPoint.y];
SCIRenderableSeriesCollection *seriesCollection = self.surface.renderableSeries;
for (NSInteger i = 0, count = seriesCollection.count; i < count; i++) {
id<ISCIRenderableSeries> rSeries = seriesCollection[i];
[rSeries hitTest:_hitTestInfo at:hitTestPoint];
[resultString appendString:[NSString stringWithFormat:@"\n%@ - %@", rSeries.dataSeries.seriesName, _hitTestInfo.isHit ? @"YES" : @"NO"]];
}
_alertPresenter = [[SCDAlertPresenter alloc] initWithMessage:resultString];
}
@end
//******************************************************************************
// SCICHART® Copyright SciChart Ltd. 2011-2019. All rights reserved.
//
// Web: http://www.scichart.com
// Support: support@scichart.com
// Sales: sales@scichart.com
//
// HitTestAPIChart.swift is part of the SCICHART® Examples. Permission is hereby granted
// to modify, create derivative works, distribute and publish any part of this source
// code whether for commercial, private or personal use.
//
// The SCICHART® examples are distributed in the hope that they will be useful, but
// without any warranty. It is provided "AS IS" without warranty of any kind, either
// expressed or implied.
//******************************************************************************
class HitTestAPIChart: SCDSingleChartViewController<SCIChartSurface> {
override var associatedType: AnyClass { return SCIChartSurface.self }
private let hitTestInfo = SCIHitTestInfo()
private var alertPresenter: SCDAlertPresenter!
override func commonInit() {
surface.addGestureRecognizer(SCITapGestureRecognizer(target: self, action: #selector(handleSingleTap)))
}
override func initExample() {
let xAxis = SCINumericAxis()
let yAxis = SCINumericAxis()
yAxis.axisAlignment = .left
yAxis.growBy = SCIDoubleRange(min: 0, max: 0.1)
let xData: [Double] = [0, 1, 2, 3, 4, 5, 6, 7, 8, 9]
let yData: [Double] = [0, 0.1, 0.3, 0.5, 0.4, 0.35, 0.3, 0.25, 0.2, 0.1]
let xValues = SCIDoubleValues()
let yValues = SCIDoubleValues()
for i in 0 ..< xData.count {
xValues.add(xData[i])
yValues.add(yData[i])
}
let dataSeries0 = SCIXyDataSeries(xType: .double, yType: .double)
dataSeries0.seriesName = "Line Series"
dataSeries0.append(x: xValues, y: yValues)
let dataSeries1 = SCIXyDataSeries(xType: .double, yType: .double)
dataSeries1.seriesName = "Mountain Series"
dataSeries1.append(x: xValues, y: SCDDataManager .scale(yValues, scale: 0.7))
let dataSeries2 = SCIXyDataSeries(xType: .double, yType: .double)
dataSeries2.seriesName = "Column Series"
dataSeries2.append(x: xValues, y: SCDDataManager .scale(yValues, scale: 0.5))
let dataSeries3 = SCIOhlcDataSeries(xType: .double, yType: .double)
dataSeries3.seriesName = "Candlestick Series"
dataSeries3.append(x: xValues, open: SCDDataManager.offset(yValues, offset: 0.5), high: SCDDataManager.offset(yValues, offset: 1), low: SCDDataManager.offset(yValues, offset: 0.3), close: SCDDataManager.offset(yValues, offset: 0.7))
let pointMarker = SCIEllipsePointMarker()
pointMarker.size = CGSize(width: 30, height: 30)
pointMarker.fillStyle = SCISolidBrushStyle(color: 0xFF4682B4)
pointMarker.strokeStyle = SCISolidPenStyle(color: 0xFFE6E6FA, thickness: 2)
let lineSeries = SCIFastLineRenderableSeries()
lineSeries.dataSeries = dataSeries0
lineSeries.strokeStyle = SCISolidPenStyle(color: 0xFF4682B4, thickness: 2)
lineSeries.pointMarker = pointMarker
let mountainSeries = SCIFastMountainRenderableSeries()
mountainSeries.dataSeries = dataSeries1
mountainSeries.areaStyle = SCISolidBrushStyle(color: 0xFFB0C4DE)
mountainSeries.strokeStyle = SCISolidPenStyle(color: 0xFF4682B4, thickness: 2)
let columnSeries = SCIFastColumnRenderableSeries()
columnSeries.dataSeries = dataSeries2
let candlestickSeries = SCIFastCandlestickRenderableSeries()
candlestickSeries.dataSeries = dataSeries3;
SCIUpdateSuspender.usingWith(surface) {
self.surface.xAxes.add(xAxis)
self.surface.yAxes.add(yAxis)
self.surface.renderableSeries.add(items: lineSeries, mountainSeries, columnSeries, candlestickSeries)
SCIAnimations.scale(lineSeries, duration: 1.5, andEasingFunction: SCICubicEase())
SCIAnimations.scale(mountainSeries, duration: 1.5, andEasingFunction: SCICubicEase())
SCIAnimations.scale(columnSeries, duration: 1.5, andEasingFunction: SCICubicEase())
SCIAnimations.scale(candlestickSeries, duration: 1.5, andEasingFunction: SCICubicEase())
}
}
@objc fileprivate func handleSingleTap(_ recognizer: SCITapGestureRecognizer) {
let location = recognizer.location(in: recognizer.view!)
let hitTestPoint = surface.translate(location, hitTestable: surface.renderableSeriesArea)
var resultString = String(format: "Touch at: (%.0f, %.0f)", hitTestPoint.x, hitTestPoint.y)
let seriesCollection = surface.renderableSeries
for i in 0 ..< seriesCollection.count {
let rSeries = seriesCollection[i]
rSeries.hitTest(hitTestInfo, at: hitTestPoint)
resultString.append("\n\(rSeries.dataSeries!.seriesName!) - \(hitTestInfo.isHit ? "true" : "false")")
}
alertPresenter = SCDAlertPresenter(message: resultString)
}
}