iOS & macOS charts - Examples
Please note! These examples are new to SciChart iOS v4 release! SciChart’s OpenGL ES and Metal iOS and Metal macOS Chart library ships with hundred of Objective-C and Swift iOS & macOS Chart Examples which you can browse, play with and view the source-code. All of this is possible with the new and improved SciChart iOS Examples Suite and demo application for Mac, which ships as part of the SciChart SDK.
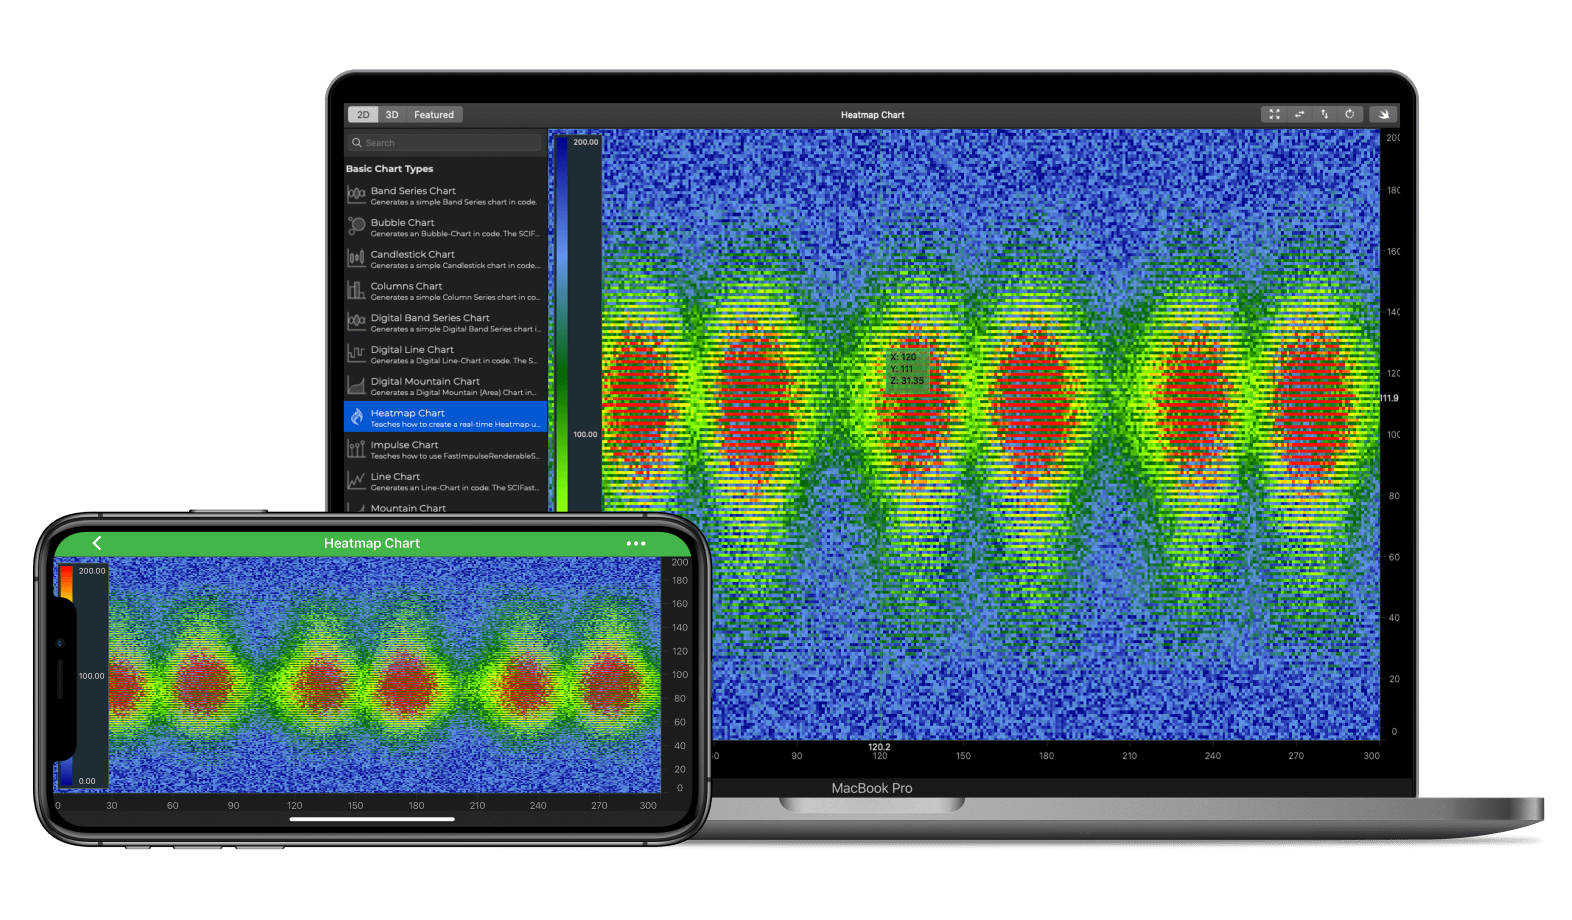
Demonstrates how to create a real-time iOS Heatmap using SciChart. See Documentation on how to use this type here: The iOS Heatmap Chart Documentation.
iOS Heatmap Charts can be used to visualise a variety of scientific and statistical data. Display a real-time spectrogram (Fourier Transform plus Time) of audio data. To overlay areas of heat on a background image such as a map or image, or to quickly bring to life 2-dimensional data and show the relative intensities via the heat color.
The SCIFastUniformHeatmapRenderableSeries expects a 2D Array of data in the form of a SCIUniformHeatmapDataSeries and has a user-defined colour map which can be displayed as a legend over the chart.
In this example you can tap and drag on the chart to see the animated-zoom performance while the heatmap is updating.
The Swift and Objective-C source code for the iOS and macOS Heatmap Chart example is included below (Scroll down!).
Did you know that we have the source code for all our example available for free on Github?
Clone the SciChart.iOS.Examples from Github.
Also the SciChart iOS and Scichart macOS Trials contain the full source for the examples (link below).


