iOS & macOS charts - Examples
Please note! These examples are new to SciChart iOS v4 release! SciChart’s OpenGL ES and Metal iOS and Metal macOS Chart library ships with hundred of Objective-C and Swift iOS & macOS Chart Examples which you can browse, play with and view the source-code. All of this is possible with the new and improved SciChart iOS Examples Suite and demo application for Mac, which ships as part of the SciChart SDK.
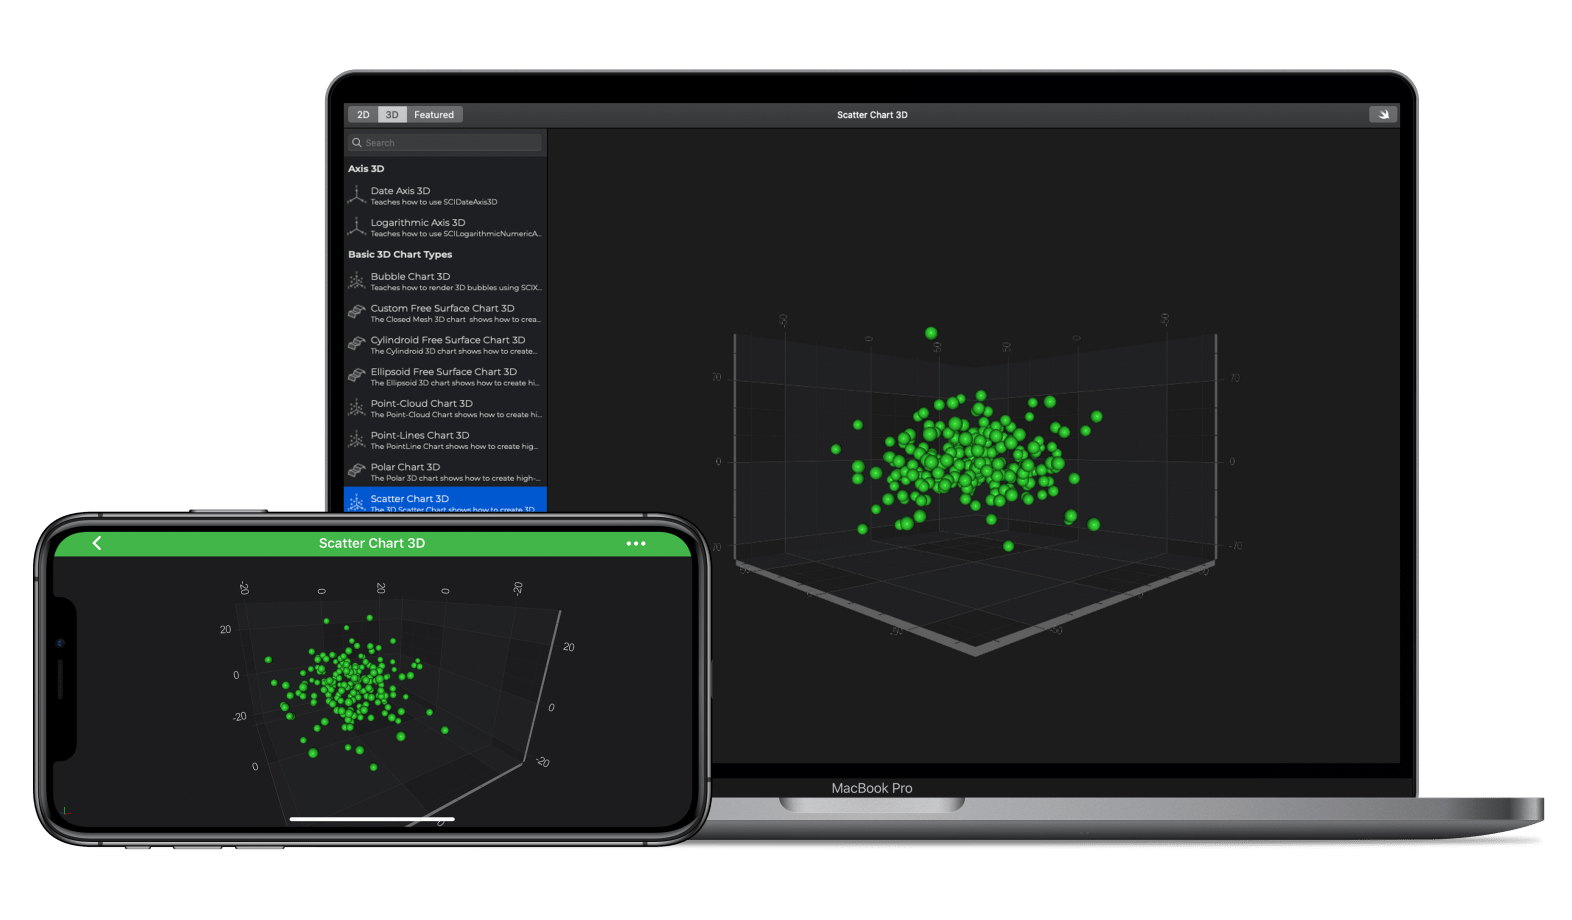
SciChart provides a variety of chart types out of the box, starting from simple iOS line charts and up to complex scientific iOS mesh chart types. This example demonstrates how to create a simple 3D Scatter Chart that is often used in scientific and engineering sectors allowing the visualisation of clustered data and for multi-variant analysis. SciChart iOS Charting Library offers SCIScatterRenderableSeries3D renderable series to create a Simple Scatter Plot in 3D.
The Shape of the scatters is defined with the PointMarkers, this could be a Sphere, Cube, Pyramid or Cylinder shape.
You can learn more about how to create iOS 3D Scatter Plots with SciChart iOS 3D Charting Library in our documentation:
The Swift and Objective-C source code for the iOS and macOS Simple Scatter 3D Chart example is included below (Scroll down!).
Did you know that we have the source code for all our example available for free on Github?
Clone the SciChart.iOS.Examples from Github.
Also the SciChart iOS and Scichart macOS Trials contain the full source for the examples (link below).


