SciChart® the market leader in Fast WPF Charts, WPF 3D Charts, iOS Chart, Android Chart and JavaScript Chart Components
Please note! These examples are new to SciChart iOS v4 release! SciChart’s OpenGL ES and Metal iOS and Metal macOS Chart library ships with hundred of Objective-C and Swift iOS&macOS Chart Examples which you can browse, play with and view the source-code. All of this is possible with the new and improved SciChart iOS Examples Suite and demo application for Mac, which ships as part of the SciChart SDK.
In SciChart iOS, we have a powerful Chart Modifier API which allows you to attach one or more behaviors onto the chart. In our iOS Chart Library, all the zooming, panning, tooltips and selection of series are implemented via SCIChartModifierBase derived types.
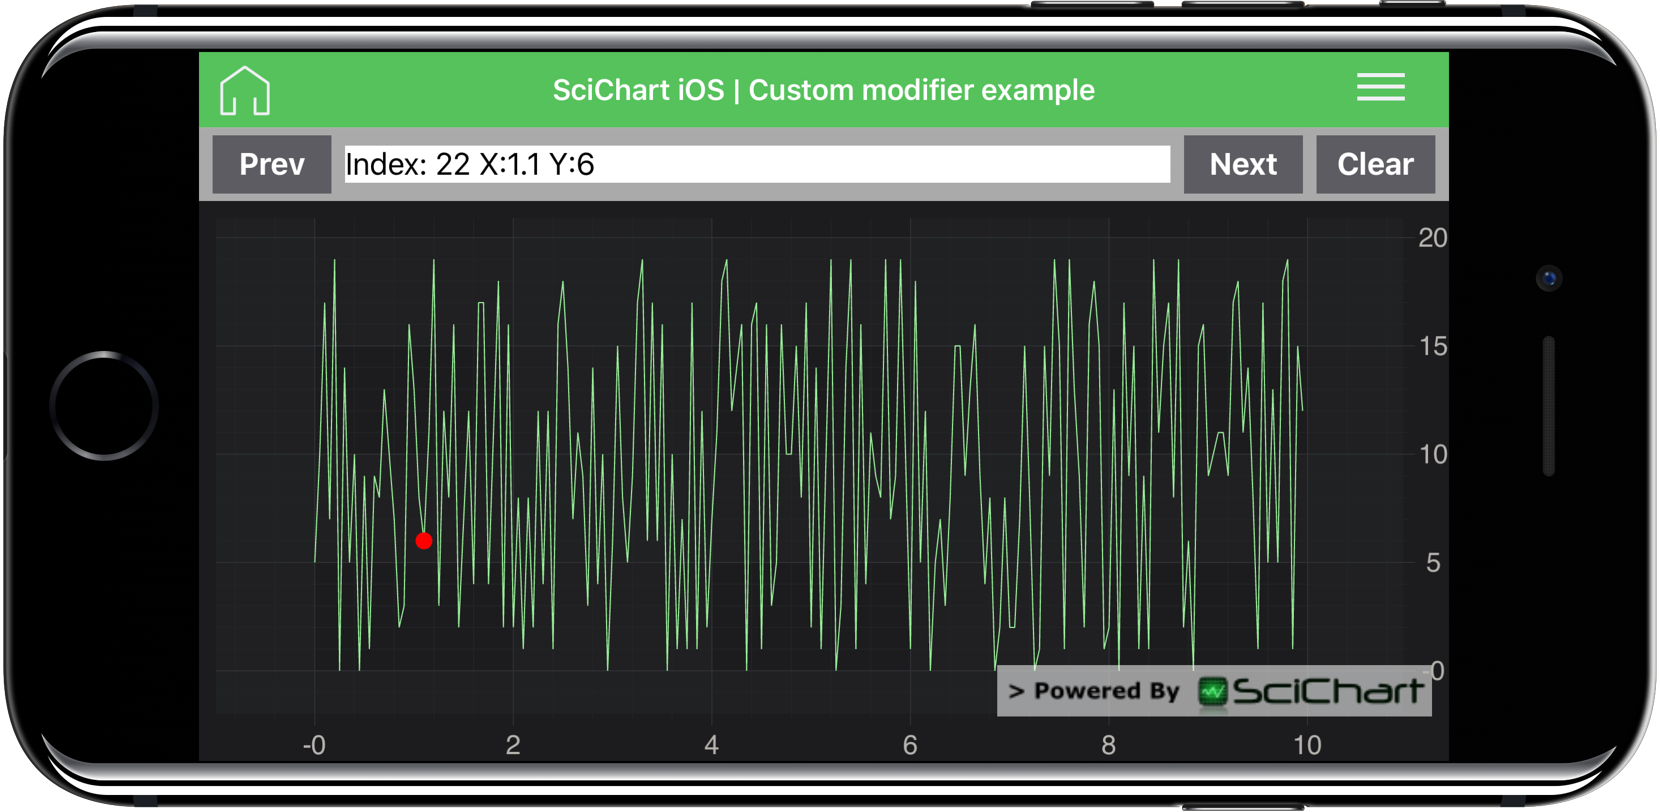
In this example we create a custom modifier which intercepts the tap gesture to draw an X-Y point on the chart. Using our powerful APIs you can create your own Chart Modifiers for interaction with the chart, whether it be custom zoom, pan operations, custom selection or hit-test of points, or custom drawing over the top of the chart.
The Swift and Objective-C source code for the iOS and macOS Chart Custom Modifier example is included below (Scroll down!).
Did you know that we have the source code for all our example available for free on Github?
Clone the SciChart.iOS.Examples from Github.
Also the SciChart iOS and Scichart macOS Trials contain the full source for the examples (link below).
//******************************************************************************
// SCICHART® Copyright SciChart Ltd. 2011-2018. All rights reserved.
//
// Web: http://www.scichart.com
// Support: support@scichart.com
// Sales: sales@scichart.com
//
// CustomModifierView.swift is part of the SCICHART® Examples. Permission is hereby granted
// to modify, create derivative works, distribute and publish any part of this source
// code whether for commercial, private or personal use.
//
// The SCICHART® examples are distributed in the hope that they will be useful, but
// without any warranty. It is provided "AS IS" without warranty of any kind, either
// expressed or implied.
//******************************************************************************
import UIKit
import SciChart
class CustomModifier : SCIGestureModifier {
let _marker = SCIEllipsePointMarker()
// position of tap gesture
var _location : CGPoint = CGPoint.zero
// if marker should be visible
var _visible : Bool = false
// x data value at point marker
var _xValue : Double = 0
// y data value at point marker
var _yValue : Double = 0
// index of data point at point marker position
var _index : Int32 = 0
// renderable series to whicj point marker is bound
var _rSeries : SCIRenderableSeriesProtocol?
// control panel for additional actions with modifier
weak var _customModifierLayout : CustomModifierLayout?
init(customModifierLayout : CustomModifierLayout) {
super.init()
_customModifierLayout = customModifierLayout
weak var wSelf = self
_customModifierLayout?.onClearClicked = { () -> Void in wSelf!.hideMarker() }
_customModifierLayout?.onNextClicked = { () -> Void in wSelf!.moveMarker(+1) }
_customModifierLayout?.onPrevClicked = { () -> Void in wSelf!.moveMarker(-1) }
_marker.strokeStyle = nil //_penStyle
_marker.fillStyle = SCISolidBrushStyle(color: UIColor.red)
}
func hideMarker() {
_visible = false;
// modifier context should be invalidated to trigger modifier redraw
let parent : SCIChartSurfaceProtocol = self.parentSurface
let context : SCIRenderContext2DProtocol = parent.renderSurface!.modifierContext()
context.invalidate()
}
func moveMarker(_ index: Int) {
if (!_visible) {
return
}
let context = parentSurface.renderSurface?.modifierContext();
let dataSeries : SCIDataSeriesProtocol = _rSeries!.currentRenderPassData.dataSeries()
// check if index is out of data series range
_index = _index + Int32(index);
let indexOutOfRange = _index < 0 || Int32(_index) >= dataSeries.count()
if (indexOutOfRange) {
_visible = false
context?.invalidate()
return
}
// get data values from data series for new index
_xValue = SCIGenericDouble(dataSeries.xValues().value(at: _index))
_yValue = SCIGenericDouble(dataSeries.yValues().value(at: _index))
if (_xValue.isNaN || _yValue.isNaN) {
_visible = false
context?.invalidate()
return;
}
// trigger modifier context to redraw
context?.invalidate()
}
func preapareDataForDrawing() {
_visible = false
let series = parentSurface.renderableSeries
// gesture coordinates is connected to whole surface, but calculators get coordinates related to chart surface only
// we need to get location on chart surface
let actualLocation : CGPoint = parentSurface.renderSurface!.point(inChartFrame: _location)
// check every renderable series for hit
for i in 0 ..< series.count() {
let rSeries : SCIRenderableSeriesProtocol! = series.item(at: UInt32(i))
let data = rSeries.currentRenderPassData
// get hit test tools
if let hitTest = rSeries.hitTestProvider() {
// hit test verticaly: check if vertical projection through touch location crosses chart
let hitTestResult = hitTest.hitTestVerticalAt(x: Double(actualLocation.x), y: Double(actualLocation.y), radius: 5, onData: data)
if (hitTestResult.match).boolValue {
// if hit is registered on series
// get values at closest point to hit test position
_xValue = SCIGenericDouble(hitTestResult.xValue)
_yValue = SCIGenericDouble(hitTestResult.yValue)
_index = hitTestResult.index
if (_xValue.isNaN || _yValue.isNaN) {
continue
}
_visible = true
_rSeries = rSeries // will be used during drawing
break
}
}
}
}
override func onTapGesture(_ gesture: UITapGestureRecognizer!, at view: UIView!) -> Bool {
let location = gesture.location(in: view)
let rs = self.parentSurface.renderSurface
if (!(rs?.isPoint(withinBounds: location))!) { return false }
if (gesture.state == .ended) {
// save location of touch
_location = location;
preapareDataForDrawing()
// invalidate modifier context to trigger redrawing of modifier
let context = parentSurface.renderSurface?.modifierContext()
context?.invalidate()
}
return true
}
override func draw () {
if (!_visible) { return }
let parent : SCIChartSurfaceProtocol = self.parentSurface
let surface : SCIRenderSurfaceProtocol = parent.renderSurface!
let context : SCIRenderContext2DProtocol = surface.modifierContext()
let area : CGRect = surface.chartFrame()
// get coordinate calculators and calculate coordinates on screen for data point
let data : SCIRenderPassDataProtocol = _rSeries!.currentRenderPassData
let xCalc : SCICoordinateCalculatorProtocol = data.xCoordinateCalculator()
let yCalc : SCICoordinateCalculatorProtocol = data.yCoordinateCalculator()
let xCoord : Double = xCalc.getCoordinateFrom(_xValue)
let yCoord : Double = yCalc.getCoordinateFrom(_yValue)
context.save()
// context needs proper area for drawing (in that case it is chart area)
context.setDrawingArea(area )
// draw point marker
_marker.draw(toContext: context, atX: Float(xCoord), y: Float(yCoord))
context.restore()
// update control panel text
_customModifierLayout?.infoLabel.text = String(format: "Index: %d X:%g Y:%g", _index, _xValue, _yValue)
}
}
class CustomModifierView: CustomModifierLayout {
override func initExample() {
let xAxis = SCINumericAxis()
xAxis.growBy = SCIDoubleRange(min: SCIGeneric(0.1), max: SCIGeneric(0.1))
let yAxis = SCINumericAxis()
yAxis.growBy = SCIDoubleRange(min: SCIGeneric(0.1), max: SCIGeneric(0.1))
let dataCount = 20
let dataSeries = SCIXyDataSeries(xType: .float, yType: .float)
for i in 0..<dataCount {
let time = 10 * Double(i) / Double(dataCount)
let x = time
let y = arc4random_uniform(20);
dataSeries.appendX(SCIGeneric(x), y: SCIGeneric(y))
}
let rSeries = SCIFastLineRenderableSeries()
rSeries.dataSeries = dataSeries
let customModifier = CustomModifier(customModifierLayout: self)
SCIUpdateSuspender.usingWithSuspendable(surface) {
self.surface.xAxes.add(xAxis)
self.surface.yAxes.add(yAxis)
self.surface.renderableSeries.add(rSeries)
self.surface.chartModifiers = SCIChartModifierCollection(childModifiers: [SCIPinchZoomModifier(), SCIZoomExtentsModifier(), customModifier])
SCIThemeManager.applyDefaultTheme(toThemeable: self.surface)
}
}
}