iOS & macOS charts - Examples
Please note! These examples are new to SciChart iOS v4 release! SciChart’s OpenGL ES and Metal iOS and Metal macOS Chart library ships with hundred of Objective-C and Swift iOS & macOS Chart Examples which you can browse, play with and view the source-code. All of this is possible with the new and improved SciChart iOS Examples Suite and demo application for Mac, which ships as part of the SciChart SDK.
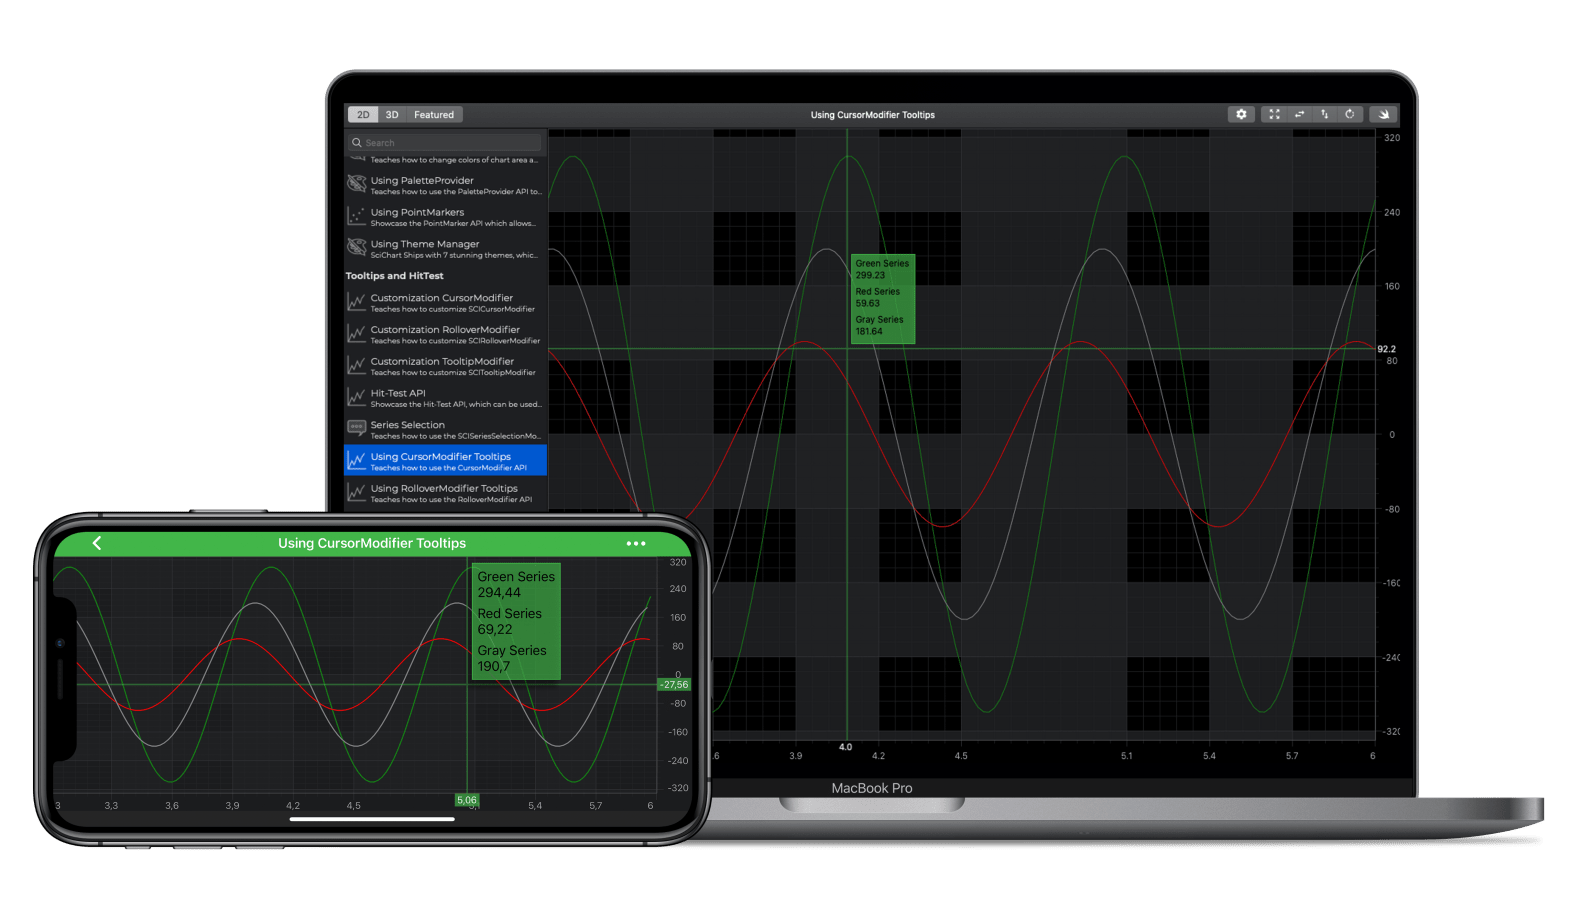
SciChart features a Cursor or Crosshairs on our iOS Charts which are provided by the SCICursorModifier. This is able to display crosshairs at the touch-location and XAxis or YAxis labels. The CursorModifier is also able to display an aggregated tooltip (all series in one tooltip).
NOTE: See documentation about the SCICursorModifier Type here.
The Swift and Objective-C source code for the iOS and macOS Chart with Crosshairs and Cursors example is included below (Scroll down!).
Did you know that we have the source code for all our example available for free on Github?
Clone the SciChart.iOS.Examples from Github.
Also the SciChart iOS and Scichart macOS Trials contain the full source for the examples (link below).


