SciChart® the market leader in Fast WPF Charts, WPF 3D Charts, iOS Chart, Android Chart and JavaScript Chart Components
Please note! These examples are new to SciChart iOS v4 release! SciChart’s OpenGL ES and Metal iOS and Metal macOS Chart library ships with hundred of Objective-C and Swift iOS&macOS Chart Examples which you can browse, play with and view the source-code. All of this is possible with the new and improved SciChart iOS Examples Suite and demo application for Mac, which ships as part of the SciChart SDK.
This example demonstrates how to create a custom animation and have complete control over data appearing on the screen. It shows how to animate the last appended point to a Line Series in real-time.
The Swift and Objective-C source code for the iOS and macOS Animating Line Chart example is included below (Scroll down!).
Did you know that we have the source code for all our example available for free on Github?
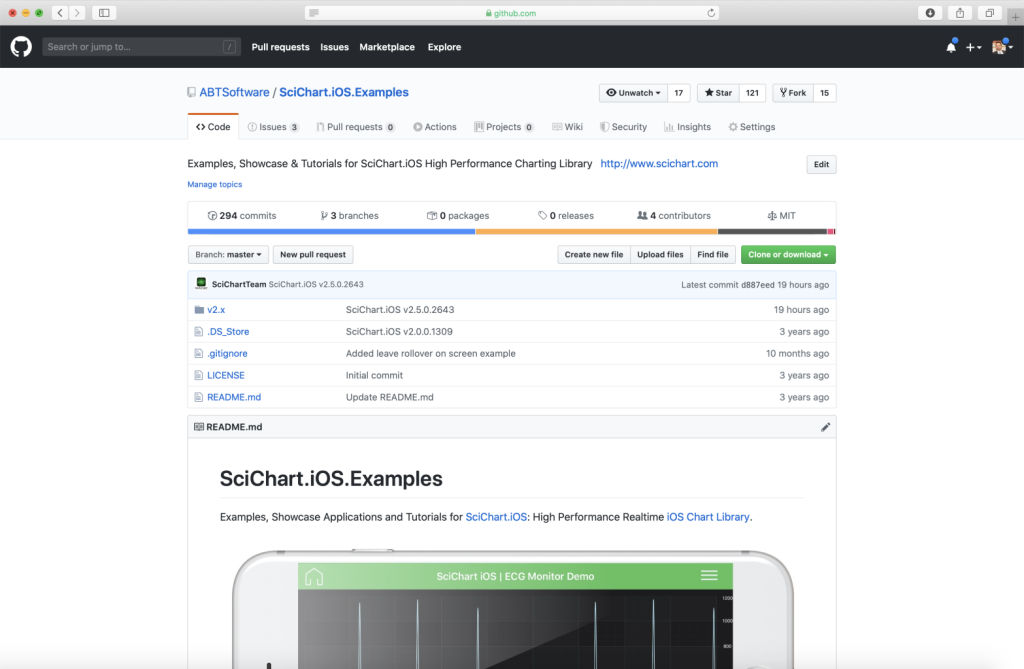
Clone the SciChart.iOS.Examples from Github.
Also the SciChart iOS and Scichart macOS Trials contain the full source for the examples (link below).
//******************************************************************************
// SCICHART® Copyright SciChart Ltd. 2011-2022. All rights reserved.
//
// Web: http://www.scichart.com
// Support: support@scichart.com
// Sales: sales@scichart.com
//
// AnimatingLineChartView.m is part of the SCICHART® Examples. Permission is hereby granted
// to modify, create derivative works, distribute and publish any part of this source
// code whether for commercial, private or personal use.
//
// The SCICHART® examples are distributed in the hope that they will be useful, but
// without any warranty. It is provided "AS IS" without warranty of any kind, either
// expressed or implied.
//******************************************************************************
#import "AnimatingLineChartView.h"
#import <SciChart/SCIBaseRenderPassDataTransformation+Protected.h>
#import "SCDRandomUtil.h"
#import "SCDToolbarItem.h"
#import "SCDToolbarButtonsGroup.h"
@interface SCDAppendedPointTransformation : SCIBaseRenderPassDataTransformation<SCILineRenderPassData *>
- (instancetype)init;
@end
@implementation SCDAppendedPointTransformation {
SCIFloatValues *_originalXCoordinates;
SCIFloatValues *_originalYCoordinates;
}
- (instancetype)init {
self = [super initWithRenderPassDataType:SCILineRenderPassData.class];
if (self) {
_originalXCoordinates = [SCIFloatValues new];
_originalYCoordinates = [SCIFloatValues new];
}
return self;
}
- (void)saveOriginalData {
if (!self.renderPassData.isValid) return;
[SCITransformationHelpers copyDataFromSource:self.renderPassData.xCoords toDest:_originalXCoordinates];
[SCITransformationHelpers copyDataFromSource:self.renderPassData.yCoords toDest:_originalYCoordinates];
}
- (void)applyTransformation {
if (!self.renderPassData.isValid) return;
id<ISCICoordinateCalculator> xCalculator = self.renderPassData.xCoordinateCalculator;
id<ISCICoordinateCalculator> yCalculator = self.renderPassData.yCoordinateCalculator;
NSInteger count = self.renderPassData.pointsCount;
float firstXStart = [xCalculator getCoordinateFrom:0];
float xStart = count <= 1 ? firstXStart : [_originalXCoordinates getValueAt:count - 2];
float xFinish = [_originalXCoordinates getValueAt:count - 1];
float additionalX = xStart + (xFinish - xStart) * self.currentTransformationValue;
[self.renderPassData.xCoords set:additionalX at:count - 1];
float firstYStart = [yCalculator getCoordinateFrom:0];
float yStart = count <= 1 ? firstYStart : [_originalYCoordinates getValueAt:count - 2];
float yFinish = [_originalYCoordinates getValueAt:count - 1];
float additionalY = yStart + (yFinish - yStart) * self.currentTransformationValue;
[self.renderPassData.yCoords set:additionalY at:count - 1];
}
- (void)discardTransformation {
[SCITransformationHelpers copyDataFromSource:_originalXCoordinates toDest:self.renderPassData.xCoords];
[SCITransformationHelpers copyDataFromSource:_originalYCoordinates toDest:self.renderPassData.yCoords];
}
- (void)onInternalRenderPassDataChanged {
[self applyTransformation];
}
@end
static int const fifoCapacicty = 20;
static double const timeInterval = 1;
static double const animationDuration = 0.5;
static double const visibleRangeMax = 10;
static double const maxYValue = 100;
@implementation AnimatingLineChartView {
SCIXyDataSeries *_dataSeries;
SCIFastLineRenderableSeries *_rSeries;
NSTimer *_timer;
BOOL _isRunning;
double _currentXValue;
}
- (Class)associatedType { return SCIChartSurface.class; }
- (BOOL)showDefaultModifiersInToolbar { return NO; }
- (NSArray<id<ISCDToolbarItem>> *)provideExampleSpecificToolbarItems {
__weak typeof(self) wSelf = self;
return @[[[SCDToolbarButtonsGroup alloc] initWithToolbarItems:@[
[[SCDToolbarItem alloc] initWithTitle:@"Start" image:[SCIImage imageNamed:@"chart.play"] andAction:^{ self->_isRunning = YES; }],
[[SCDToolbarItem alloc] initWithTitle:@"Pause" image:[SCIImage imageNamed:@"chart.pause"] andAction:^{ self->_isRunning = NO; }],
[[SCDToolbarItem alloc] initWithTitle:@"Stop" image:[SCIImage imageNamed:@"chart.stop"] andAction:^{
self->_isRunning = NO;
[wSelf resetChart];
}],
]]];
}
- (void)initExample {
_dataSeries = [[SCIXyDataSeries alloc] initWithXType:SCIDataType_Double yType:SCIDataType_Double];
_dataSeries.fifoCapacity = fifoCapacicty;
_rSeries = [SCIFastLineRenderableSeries new];
_rSeries.dataSeries = _dataSeries;
_rSeries.strokeStyle = [[SCISolidPenStyle alloc] initWithColorCode:0xFF4083B7 thickness:6];
_currentXValue = 0;
id<ISCIAxis> xAxis = [SCINumericAxis new];
xAxis.visibleRange = [[SCIDoubleRange alloc] initWithMin:-1 max:visibleRangeMax];
id<ISCIAxis> yAxis = [SCINumericAxis new];
yAxis.growBy = [[SCIDoubleRange alloc] initWithMin:0.0 max:0.1];
yAxis.visibleRange = [[SCIDoubleRange alloc] initWithMin:0 max:maxYValue];
[SCIUpdateSuspender usingWithSuspendable:self.surface withBlock:^{
[self.surface.xAxes add:xAxis];
[self.surface.yAxes add:yAxis];
[self.surface.renderableSeries add:self->_rSeries];
}];
[self p_SCD_addPointAnimated];
_timer = [NSTimer scheduledTimerWithTimeInterval:timeInterval target:self selector:@selector(p_SCD_updateData) userInfo:nil repeats:YES];
_isRunning = YES;
}
- (void)p_SCD_updateData {
if (!_isRunning) return;
[self p_SCD_addPointAnimated];
}
- (void)p_SCD_addPointAnimated {
[SCIUpdateSuspender usingWithSuspendable:self.surface withBlock:^{
[self->_dataSeries appendX:@(self->_currentXValue) y:@(SCDRandomUtil.nextDouble * maxYValue)];
}];
[SCIAnimations animateSeries:_rSeries withTransformation:[SCDAppendedPointTransformation new] duration:animationDuration andEasingFunction:[SCICubicEase new]];
_currentXValue += timeInterval;
[self p_SCD_animateVisibleRangeIfNeeded];
}
- (void)p_SCD_animateVisibleRangeIfNeeded {
if (_currentXValue > visibleRangeMax) {
id<ISCIAxis> xAxis = [self.surface.xAxes itemAt:0];
id<ISCIRange> newRange = [[SCIDoubleRange alloc] initWithMin:xAxis.visibleRange.minAsDouble + timeInterval max:xAxis.visibleRange.maxAsDouble + timeInterval];
[xAxis animateVisibleRangeTo:newRange withDuration:animationDuration];
}
}
- (void)resetChart {
[SCIUpdateSuspender usingWithSuspendable:self.surface withBlock:^{
[self->_dataSeries clear];
}];
_currentXValue = 0;
id<ISCIAxis> xAxis = [self.surface.xAxes itemAt:0];
[xAxis animateVisibleRangeTo:[[SCIDoubleRange alloc] initWithMin:-1 max:visibleRangeMax] withDuration:animationDuration];
}
- (void)viewDidDisappear:(BOOL)animated {
[super viewDidDisappear:animated];
[_timer invalidate];
_timer = nil;
}
@end
//******************************************************************************
// SCICHART® Copyright SciChart Ltd. 2011-2022. All rights reserved.
//
// Web: http://www.scichart.com
// Support: support@scichart.com
// Sales: sales@scichart.com
//
// AnimatingLineChartView.swift is part of the SCICHART® Examples. Permission is hereby granted
// to modify, create derivative works, distribute and publish any part of this source
// code whether for commercial, private or personal use.
//
// The SCICHART® examples are distributed in the hope that they will be useful, but
// without any warranty. It is provided "AS IS" without warranty of any kind, either
// expressed or implied.
//******************************************************************************
import Foundation
import SciChart.Protected.SCIBaseRenderPassDataTransformation
class AnimatingLineChartView: SCDSingleChartViewController<SCIChartSurface> {
private var timer: Timer?
private var isRunning = true
private var currentXValue: Double = 0
private let fifoCapacity = 20
private let timeInterval: TimeInterval = 1
private let animationDuration: TimeInterval = 0.5
private let visibleRangeMax: Double = 10
private let maxYValue: Double = 100
private let rSeries = SCIFastLineRenderableSeries()
private let dataSeries = SCIXyDataSeries(xType: .double, yType: .double)
override var associatedType: AnyClass { return SCIChartSurface.self }
override var showDefaultModifiersInToolbar: Bool { false }
override func provideExampleSpecificToolbarItems() -> [ISCDToolbarItem] {
return [SCDToolbarButtonsGroup(toolbarItems: [
SCDToolbarButton(title: "Start", image: SCIImage(named: "chart.play"), andAction: { [weak self] in self?.isRunning = true }),
SCDToolbarButton(title: "Pause", image: SCIImage(named: "chart.pause"), andAction: { [weak self] in self?.isRunning = false }),
SCDToolbarButton(title: "Stop", image: SCIImage(named: "chart.stop"), andAction: { [weak self] in
self?.isRunning = false
self?.resetChart()
})
])]
}
override func initExample() {
let xAxis = SCINumericAxis()
xAxis.visibleRange = SCIDoubleRange(min: -1, max: Double(visibleRangeMax))
let yAxis = SCINumericAxis()
yAxis.growBy = SCIDoubleRange(min: 0.1, max: 0.1)
yAxis.visibleRange = SCIDoubleRange(min: 0, max: maxYValue)
dataSeries.fifoCapacity = fifoCapacity
rSeries.dataSeries = dataSeries
rSeries.strokeStyle = SCISolidPenStyle(color: 0xFF4083B7, thickness: 6)
SCIUpdateSuspender.usingWith(surface) {
self.surface.xAxes.add(xAxis)
self.surface.yAxes.add(yAxis)
self.surface.renderableSeries.add(self.rSeries)
}
addPointAnimated()
timer = Timer.scheduledTimer(timeInterval: timeInterval, target: self, selector: #selector(updateData), userInfo: nil, repeats: true)
}
@objc func updateData() {
if !isRunning { return }
addPointAnimated()
}
private func addPointAnimated() {
SCIUpdateSuspender.usingWith(surface) { [weak self] in
guard let self = self else { return }
self.dataSeries.append(x: self.currentXValue, y: SCDRandomUtil.nextDouble() * self.maxYValue)
}
SCIAnimations.animate(
rSeries,
with: AppendedPointTransformation(),
duration: animationDuration,
andEasingFunction: SCICubicEase()
)
currentXValue += timeInterval
animateVisibleRangeIfNeeded()
}
private func animateVisibleRangeIfNeeded() {
if currentXValue > visibleRangeMax {
let xAxis = surface.xAxes.item(at: 0)
let newRange = SCIDoubleRange(
min: xAxis.visibleRange.minAsDouble + timeInterval,
max: xAxis.visibleRange.maxAsDouble + timeInterval
)
xAxis.animateVisibleRange(to: newRange, withDuration: Float(animationDuration))
}
}
private func resetChart() {
SCIUpdateSuspender.usingWith(self.surface) {
self.dataSeries.clear()
}
self.currentXValue = 0
self.surface.xAxes.firstOrDefault()?.animateVisibleRange(
to: SCIDoubleRange(min: -1, max: Double(self.visibleRangeMax)),
withDuration: Float(self.animationDuration)
)
}
override func viewDidDisappear(_ animated: Bool) {
timer?.invalidate()
timer = nil
}
private class AppendedPointTransformation: SCIBaseRenderPassDataTransformation<SCILineRenderPassData> {
private let originalXCoordinates = SCIFloatValues()
private let originalYCoordinates = SCIFloatValues()
init() {
super.init(renderPassDataType: SCILineRenderPassData.self)
}
override func saveOriginalData() {
guard let renderPassData = self.renderPassData, renderPassData.isValid else { return }
SCITransformationHelpers.copyData(fromSource: renderPassData.xCoords, toDest: originalXCoordinates)
SCITransformationHelpers.copyData(fromSource: renderPassData.yCoords, toDest: originalYCoordinates)
}
override func applyTransformation() {
guard
let renderPassData = self.renderPassData,
renderPassData.isValid,
let xCalculator = renderPassData.xCoordinateCalculator,
let yCalculator = renderPassData.yCoordinateCalculator
else { return }
let count = renderPassData.pointsCount
let firstXStart = xCalculator.getCoordinate(0)
let xStart = count <= 1 ? firstXStart : originalXCoordinates.getValueAt(count - 2)
let xFinish = originalXCoordinates.getValueAt(count - 1)
let additionalX = xStart + (xFinish - xStart) * currentTransformationValue
renderPassData.xCoords.set(additionalX, at: count - 1)
let firstYStart = yCalculator.getCoordinate(0)
let yStart = count <= 1 ? firstYStart : originalYCoordinates.getValueAt(count - 2)
let yFinish = originalYCoordinates.getValueAt(count - 1)
let additionalY = yStart + (yFinish - yStart) * currentTransformationValue
renderPassData.yCoords.set(additionalY, at: count - 1)
}
override func discardTransformation() {
guard let renderPassData = self.renderPassData else { return }
SCITransformationHelpers.copyData(fromSource: originalXCoordinates, toDest: renderPassData.xCoords)
SCITransformationHelpers.copyData(fromSource: originalYCoordinates, toDest: renderPassData.yCoords)
}
override func onInternalRenderPassDataChanged() {
applyTransformation()
}
}
}