 View on GitHub
iOS & macOS Charting Documentation - SciChart iOS & macOS Charts SDK v4.x
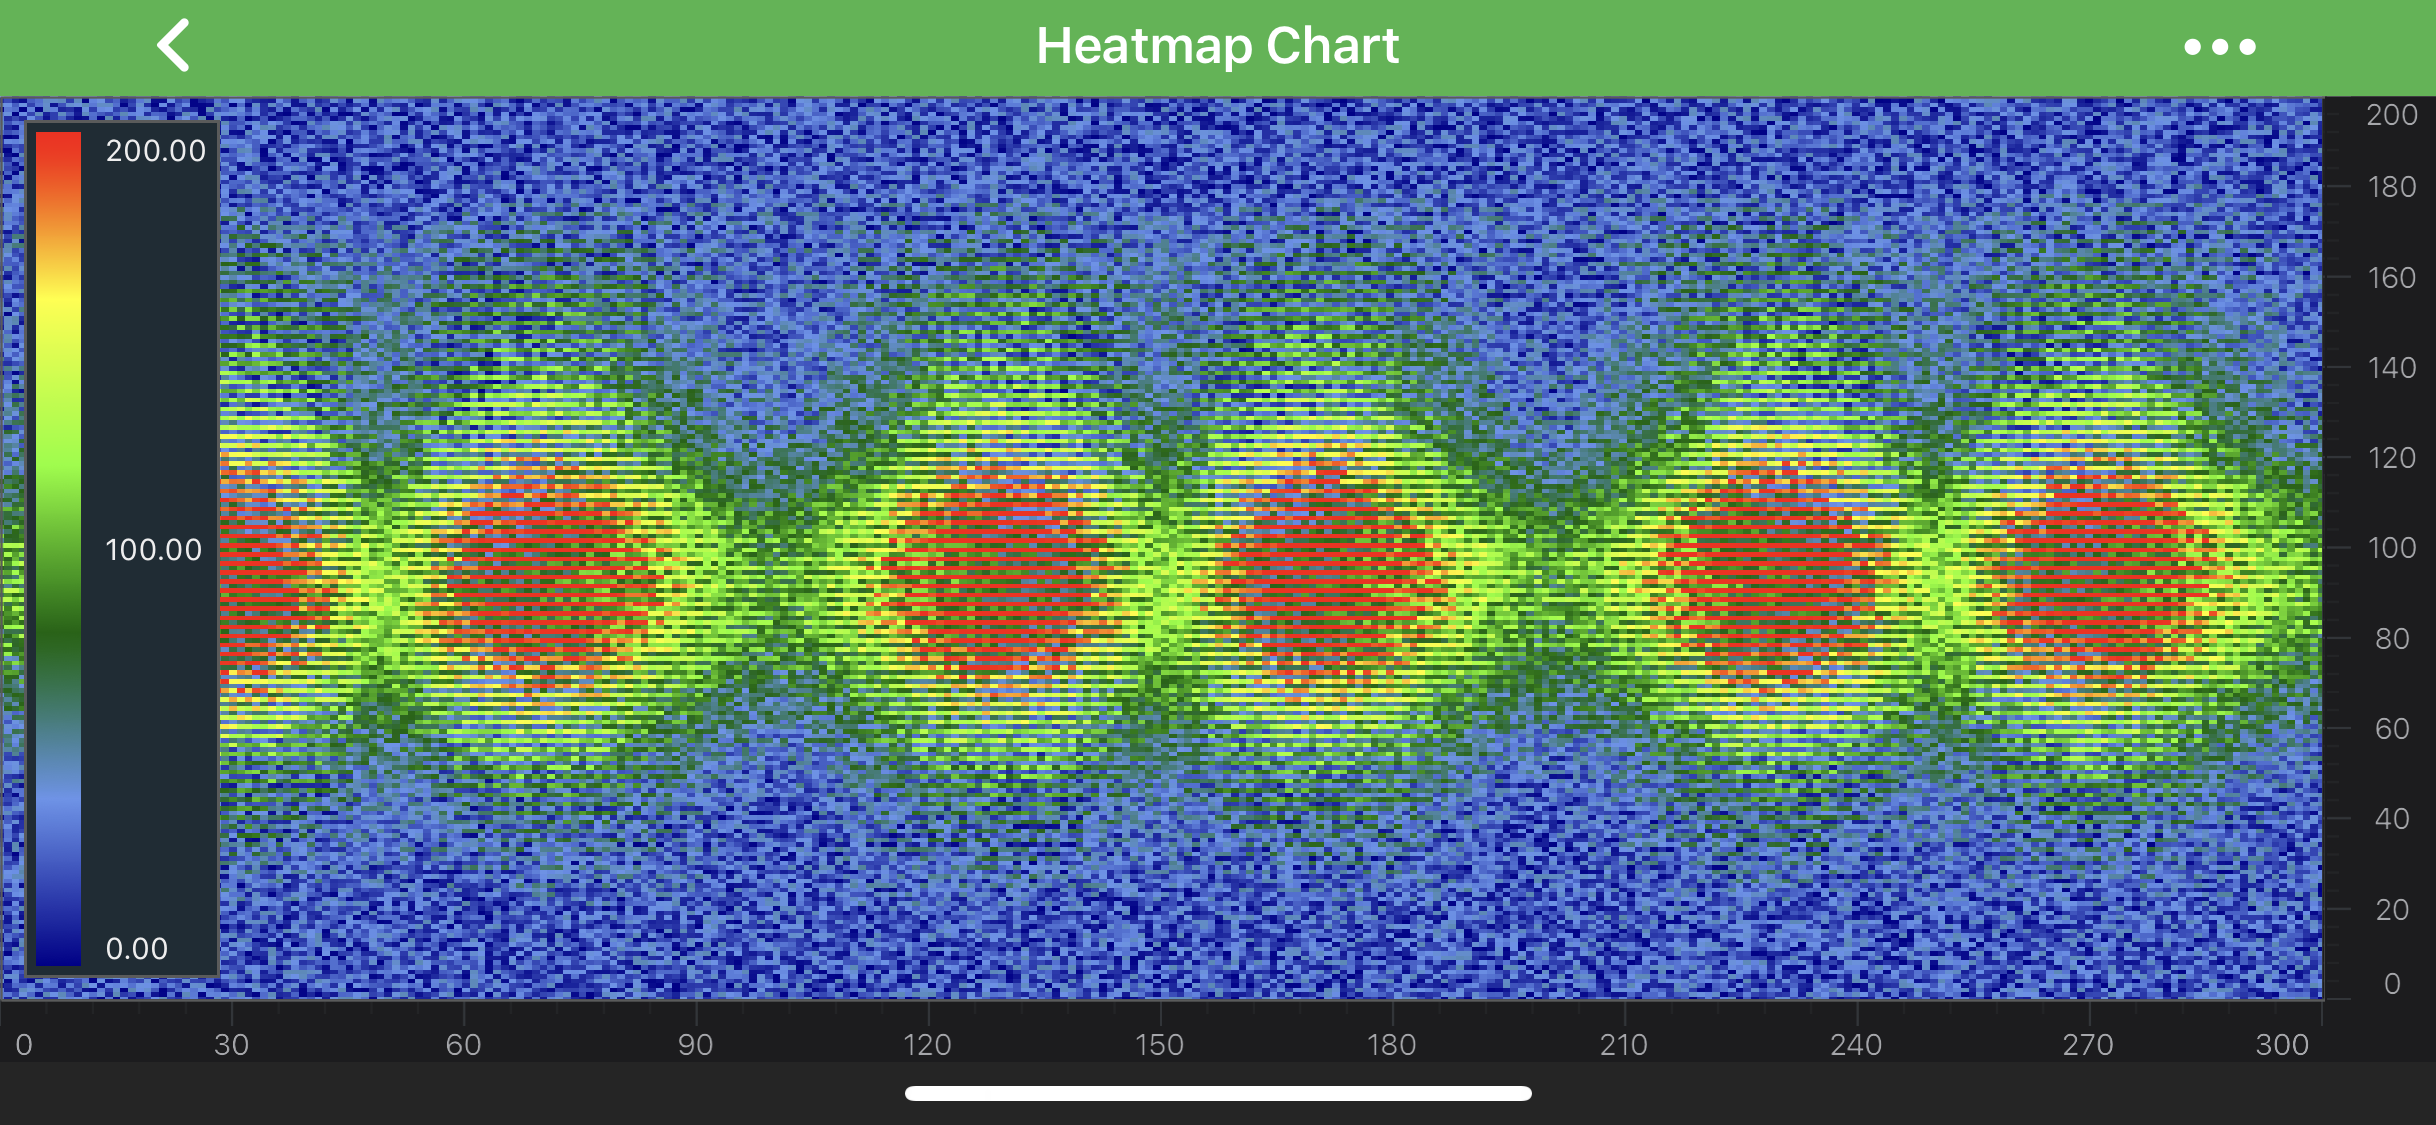
The Uniform Heatmap Series Type
Heatmaps are provided by the SCIFastUniformHeatmapRenderableSeries, which consumes data from a SCIUniformHeatmapDataSeries.
This is designed to display 2D array of data with real values. Every item in the 2D array is represented as a colored rectangle - cell. The color depends on corresponding item’s Z-Value.
NOTE: For more info about
SCIUniformHeatmapDataSeries, as well as other DataSeries types in SciChart, see the DataSeries API article.
NOTE: Examples for the Uniform Heatmap Series can be found in the SciChart iOS Examples Suite as well as on GitHub:
Uniform heatmaps are extremely fast, lightweight series types for rendering two dimensional data as a heatmap or spectrogram. As mentioned above - the SCIFastUniformHeatmapRenderableSeries type should be used in conjunction with a SCIUniformHeatmapDataSeries, when you simply want to specify a Step in the X, Y direction (each cell is the same size).
All Z-Values should fall into the range determined by the Minimum, Maximum values (they may go beyond it though), which are available via the following properties:
Also, Uniform Heatmap Series requires a SCIColorMap to be set. The ColorMap determines how a gradient color transition occurs and can be applied via the SCIFastUniformHeatmapRenderableSeries.colorMap property.
Add a Legend onto a Heatmap Chart
There is a special view designed to be used in tandem with SCIFastUniformHeatmapRenderableSeries called SCIChartHeatmapColourMap. It is not required by a Heatmap and is fully optional. It can be placed anywhere on the layout.
Similarly to the SCIFastUniformHeatmapRenderableSeries, the SCIChartHeatmapColourMap type allows to set the Minimum, Maximum values and apply a ColorMap. All these can be assigned via the corresponding properties:
SCIChartHeatmapColourMap.minimum;SCIChartHeatmapColourMap.maximum;SCIChartHeatmapColourMap.colourMap.
The numeric labels can be formatted by apply TextFormatting to them via the SCIChartHeatmapColourMap.textFormat property.
Finally, there is the SCIChartHeatmapColourMap.orientation property to specify whether the legend appears Horizontally or Vertically.
Create a Heatmap Series
To create a Uniform Heatmap Chart, use the following code:
The code above creates a Heatmap with a ColorMap that has gradient transitions between five colors and a SCIChartHeatmapColourMap Legend to it.
NOTE: In multi axis scenarios, a series has to be assigned to particular X and Y axes. This can be done by passing the axes IDs to the
ISCIRenderableSeries.xAxisId,ISCIRenderableSeries.yAxisIdproperties.
Updating Data in the Heatmap
The SCIUniformHeatmapDataSeries does not support Append, Insert, Update, Remove like the other DataSeries do. You can, however, update the data by simply updating the array passed in. There are a bunch of methods provided to update Heatmap data:
-[ISCIUniformHeatmapDataSeries updateZ:atX:y:]- updates Z Value at specified xIndex and yIndex;-[ISCIUniformHeatmapDataSeries updateZArray:]- updates all Z values for this series;-[ISCIUniformHeatmapDataSeries updateZArray:atX:y:]- updates the range of Z values for this series;-[ISCIUniformHeatmapDataSeries updateZValues:]- updates all Z values for this series;-[ISCIUniformHeatmapDataSeries updateZValues:atX:y:]- updates the range of Z values for this series.
NOTE: It is highly recommended to update
SCIUniformHeatmapDataSeriesusing ourISCIValueswhich allows to omit the boxing/unboxing of values, to make sure you get the most out of performance during your updates.