iOS & macOS Charting Documentation - SciChart iOS & macOS Charts SDK v4.x
Axis 3D Ticks - TickProvider, DeltaCalculator and TickCoordinatesProvider APIs
Axes in SciChart 3D shares the same SCIAxisCore base class with SciChart 2D Axes.
Many of the AxisCore features are shared.
For your convenience, some of the documentation has been duplicated here, with some references to other sections of the user manual.
Axis 3D Ticks, Labels and Grid Lines
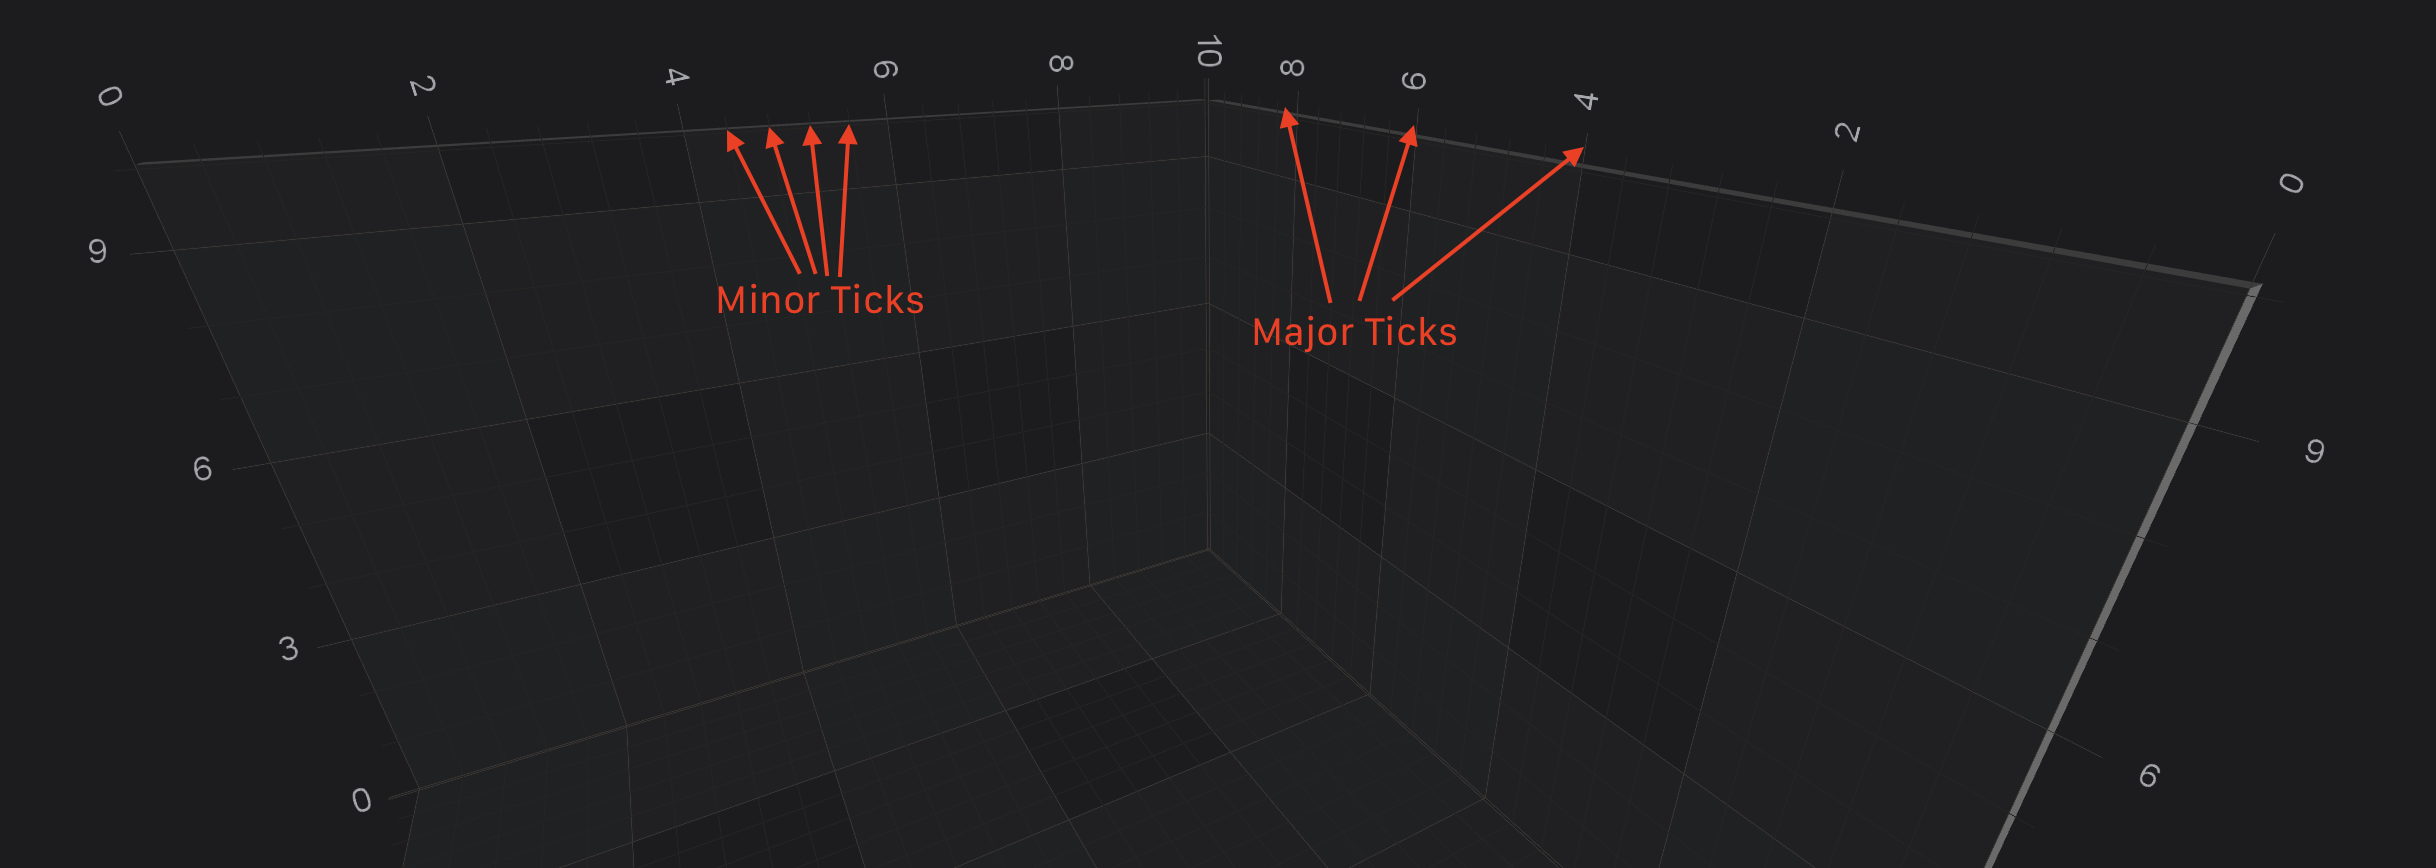
In SciChart, the Ticks are small marks around the chart on an axis. There are Minor and Major Ticks, where Minor Ticks are placed in between Major ones. By default, Major Ticks are longer and thicker than Minor Ticks.
Axis Labels appears for every Major Tick, if there is enough space around.
Grid Lines correspond to Ticks on an axis. Likewise, there are Minor and Major Grid lines. In SciChart, axes are responsible not only for drawing Ticks and Labels, but also for the Chart Grid as well as Axis Bands.

NOTE: The Axis Ticks configuration is shared between SciChart 2D and SciChart 3D. For a full walk-through, including code-samples, please see the Axis Ticks - MajorDelta, MinorDelta and AutoTicks article.
Axis 3D TickProvider and DeltaCalculator
The TickProvider and DeltaCalculator APIs allows to further customize Axis Ticks, Labels and GridLines the [MajorDelta, MinorDelta], above and beyond of what you can achieve by setting ISCIAxisCore.majorDelta and ISCIAxisCore.minorDelta. That allows you to have a totally custom set of axis ticks (grid-lines, label intervals) on the chart.
NOTE: This is a shared API between SciChart 2D and SciChart 3D. For a full walk-through of the
ISCITickProviderandISCIDeltaCalculatorAPIs, including code-samples, please see the Axis Ticks - TickProvider and DeltaCalculator API article.
In addition to the above, you can also provide custom ISCIAxisCore.tickCoordinatesProvider, which is also described in SciChart 2D Documentation. Please refer to the - Axis Ticks - TickCoordinatesProvider API - for more information on that topic.
 View on GitHub