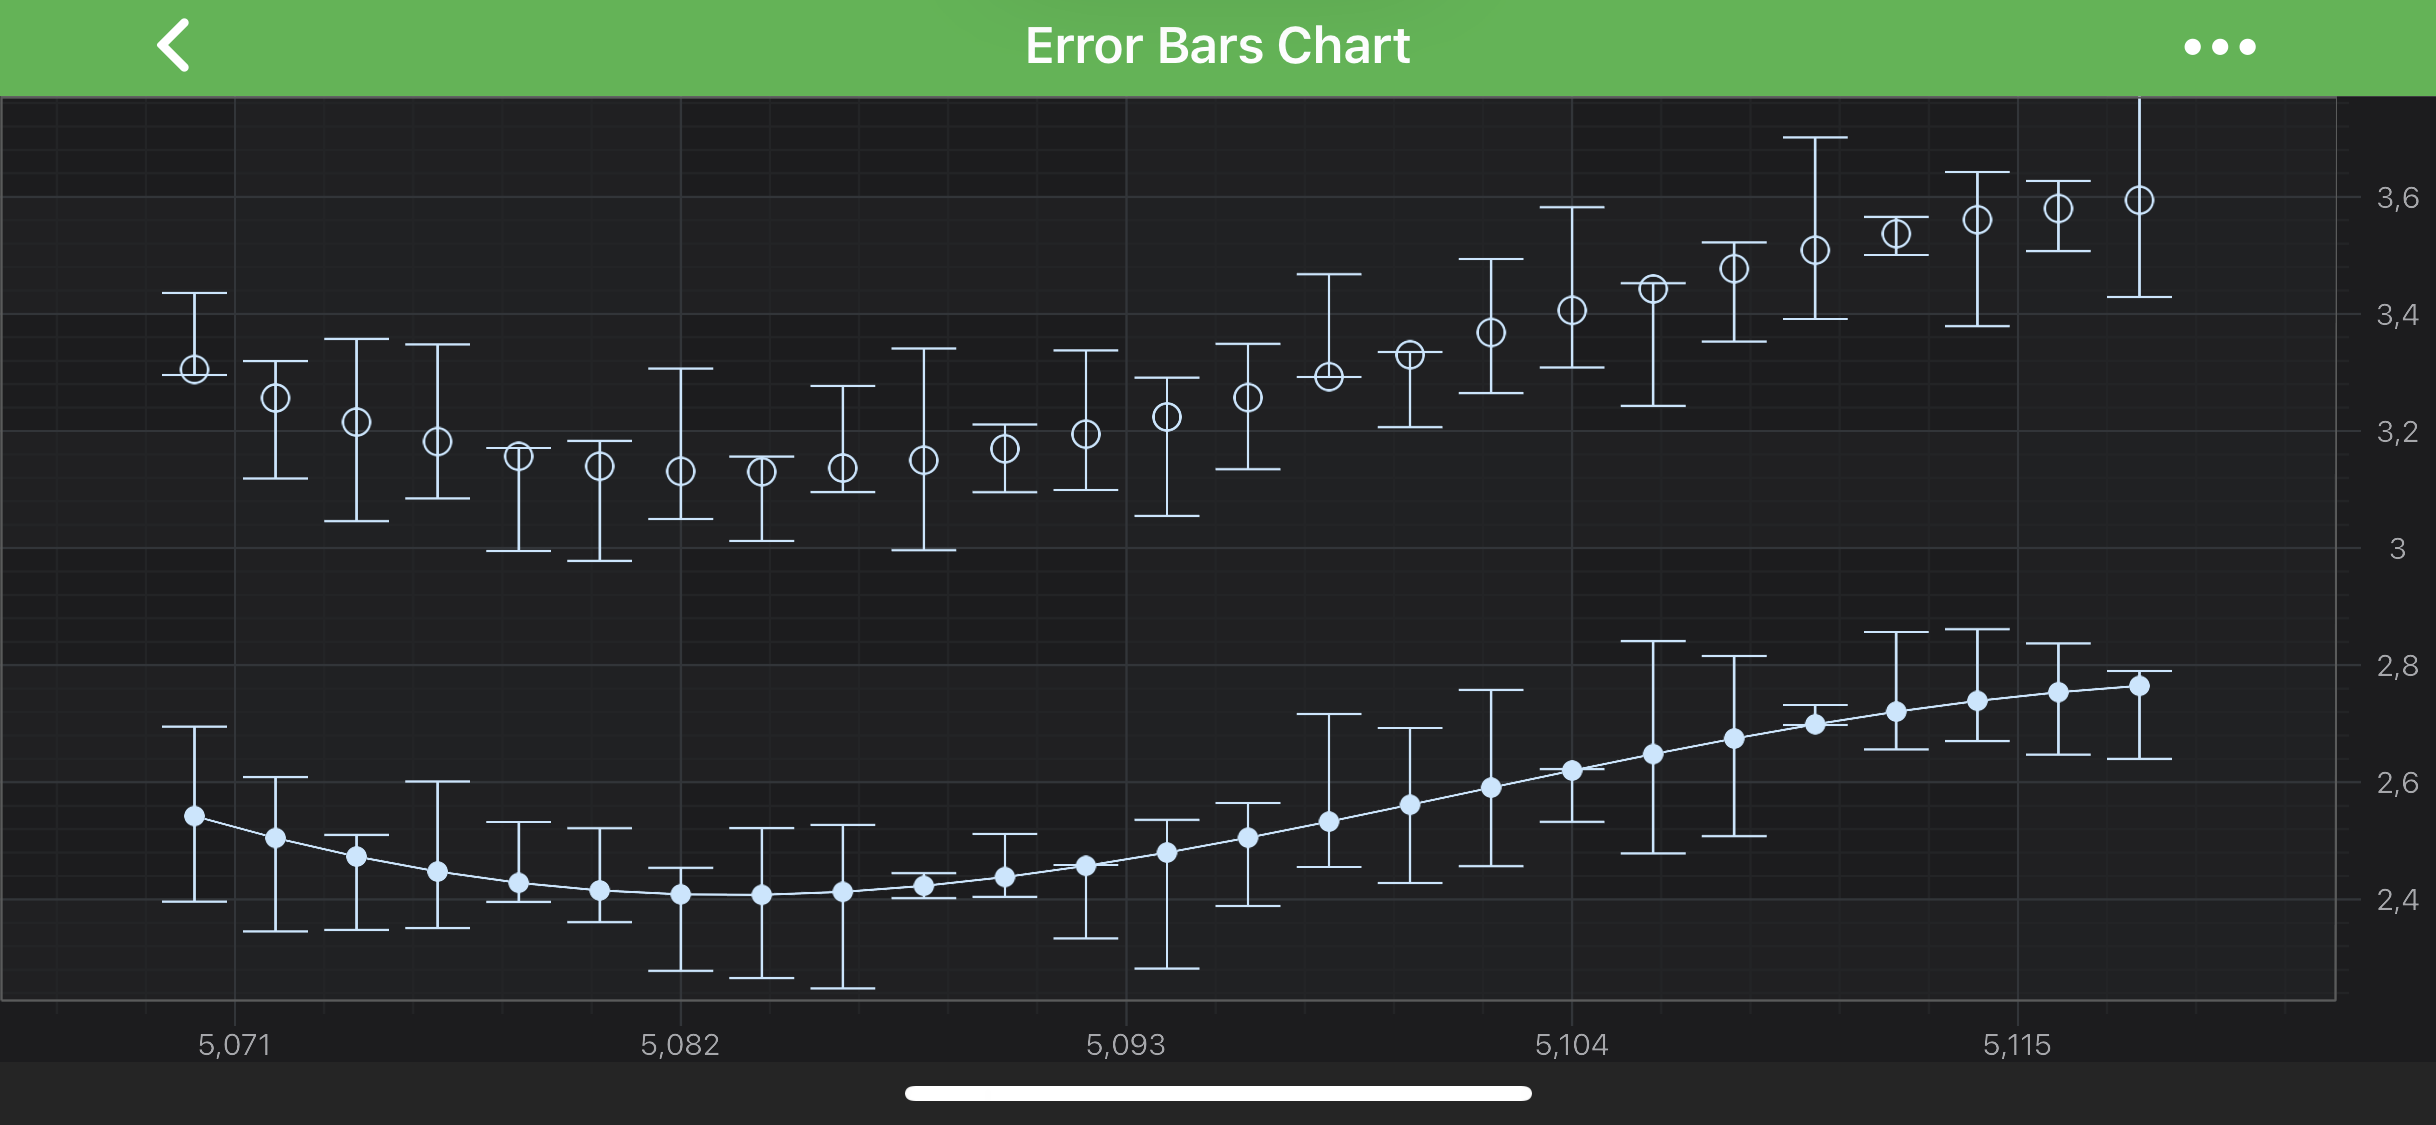
NOTE: This series type can be used in tandem with other series types, such as SCIXyScatterRenderableSeries. Error Bars Series can share a DataSeries with other series, to avoid data duplication.
To Create Error Bars Series, use the following code:
// Assume a surface has been created and configured somewhere
id<ISCIChartSurface> surface;
// Create DataSeries and fill it with some data
SCIXyDataSeries *dataSeries0 = [[SCIXyDataSeries alloc] initWithXType:SCIDataType_Double yType:SCIDataType_Double];
SCIHlDataSeries *dataSeries1 = [[SCIHlDataSeries alloc] initWithXType:SCIDataType_Double yType:SCIDataType_Double];
uint color = 0xFFC6E6FF;
// Create Fixed ErrorBars Series
SCIFastFixedErrorBarsRenderableSeries *errorBars0 = [SCIFastFixedErrorBarsRenderableSeries new];
errorBars0.dataSeries = dataSeries0;
errorBars0.strokeStyle = [[SCISolidPenStyle alloc] initWithColorCode:color thickness:1.f];
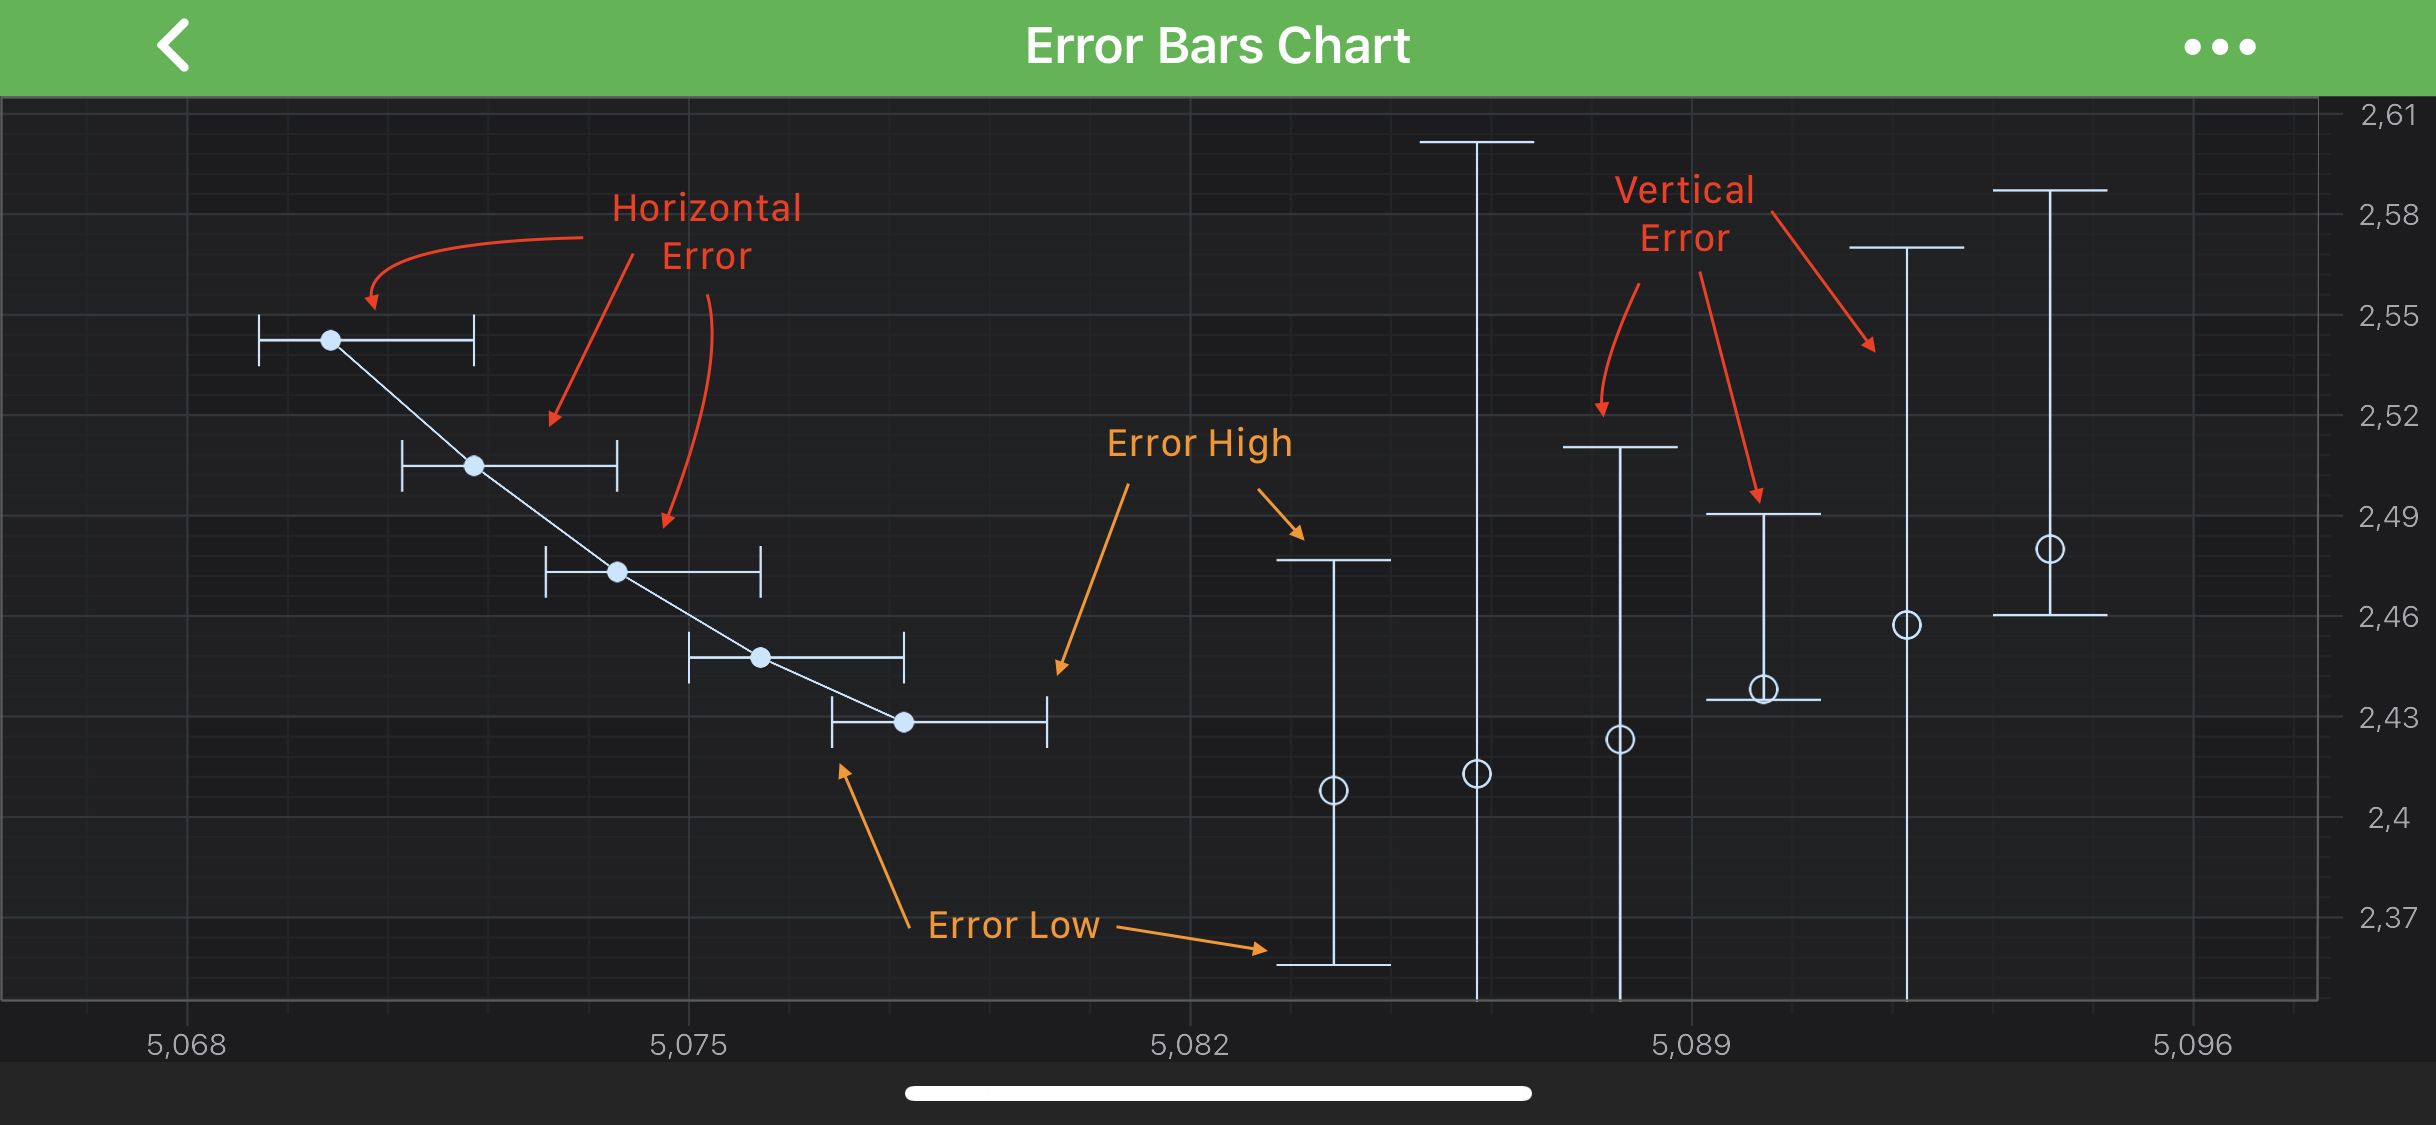
errorBars0.errorDirection = SCIErrorDirection_Horizontal;
errorBars0.errorLow = 0.001;
errorBars0.errorHigh = 0.002;
errorBars0.errorType = SCIErrorType_Absolute;
// Create ErrorBars Series
SCIFastErrorBarsRenderableSeries *errorBars1 = [SCIFastErrorBarsRenderableSeries new];
errorBars1.dataSeries = dataSeries1;
errorBars1.strokeStyle = [[SCISolidPenStyle alloc] initWithColorCode:color thickness:1.f];
errorBars1.errorDirection = SCIErrorDirection_Vertical;
errorBars1.errorType = SCIErrorType_Absolute;
[surface.renderableSeries addAll:errorBars0, errorBars1, nil];
// Assume a surface has been created and configured somewhere
let surface: ISCIChartSurface
// Create DataSeries and fill it with some data
let dataSeries0 = SCIXyDataSeries(xType: .double, yType: .double)
let dataSeries1 = SCIHlDataSeries(xType: .double, yType: .double)
let color: uint = 0xFFC6E6FF
// Create Fixed ErrorBars Series
let errorBars0 = SCIFastFixedErrorBarsRenderableSeries()
errorBars0.dataSeries = dataSeries0
errorBars0.strokeStyle = SCISolidPenStyle(colorCode: color, thickness: 1.0)
errorBars0.errorDirection = .horizontal
errorBars0.errorLow = 0.001
errorBars0.errorHigh = 0.002
errorBars0.errorType = .absolute
// Create ErrorBars Series
let errorBars1 = SCIFastErrorBarsRenderableSeries()
errorBars1.dataSeries = dataSeries1
errorBars1.strokeStyle = SCISolidPenStyle(colorCode: color, thickness: 1.0)
errorBars1.errorDirection = .vertical
errorBars1.errorType = .absolute
surface.renderableSeries.add(items: errorBars0, errorBars1)
// Assume a surface has been created and configured somewhere
IISCIChartSurface surface;
// Create DataSeries and fill it with some data
var dataSeries0 = new XyDataSeries<double, double>();
var dataSeries1 = new HlDataSeries<double, double>();
const uint color = 0xFFC6E6FF;
// Create Fixed ErrorBars Series
var errorBars0 = new SCIFastFixedErrorBarsRenderableSeries
{
DataSeries = dataSeries0,
StrokeStyle = new SCISolidPenStyle(color, 1f),
ErrorDirection = SCIErrorDirection.Horizontal,
ErrorLow = 0.001,
ErrorHigh = 0.002,
ErrorType = SCIErrorType.Absolute
};
// Create ErrorBars Series
var errorBars1 = new SCIFastErrorBarsRenderableSeries
{
DataSeries = dataSeries1,
StrokeStyle = new SCISolidPenStyle(color, 1f),
ErrorDirection = SCIErrorDirection.Vertical,
ErrorType = SCIErrorType.Absolute
};
surface.RenderableSeries = new SCIRenderableSeriesCollection { errorBars0, errorBars1};
Render a Gap in a ErrorBars Series
It’s possible to render a Gap in ErrorBars series, by passing a data point with a NaN as the Y value. Please refer to the RenderableSeries APIs article for more details.
 View on GitHub