SciChart® the market leader in Fast WPF Charts, WPF 3D Charts, iOS Chart, Android Chart and JavaScript Chart Components
Please note! These examples are new to SciChart iOS v4 release! SciChart’s OpenGL ES and Metal iOS and Metal macOS Chart library ships with hundred of Objective-C and Swift iOS&macOS Chart Examples which you can browse, play with and view the source-code. All of this is possible with the new and improved SciChart iOS Examples Suite and demo application for Mac, which ships as part of the SciChart SDK.
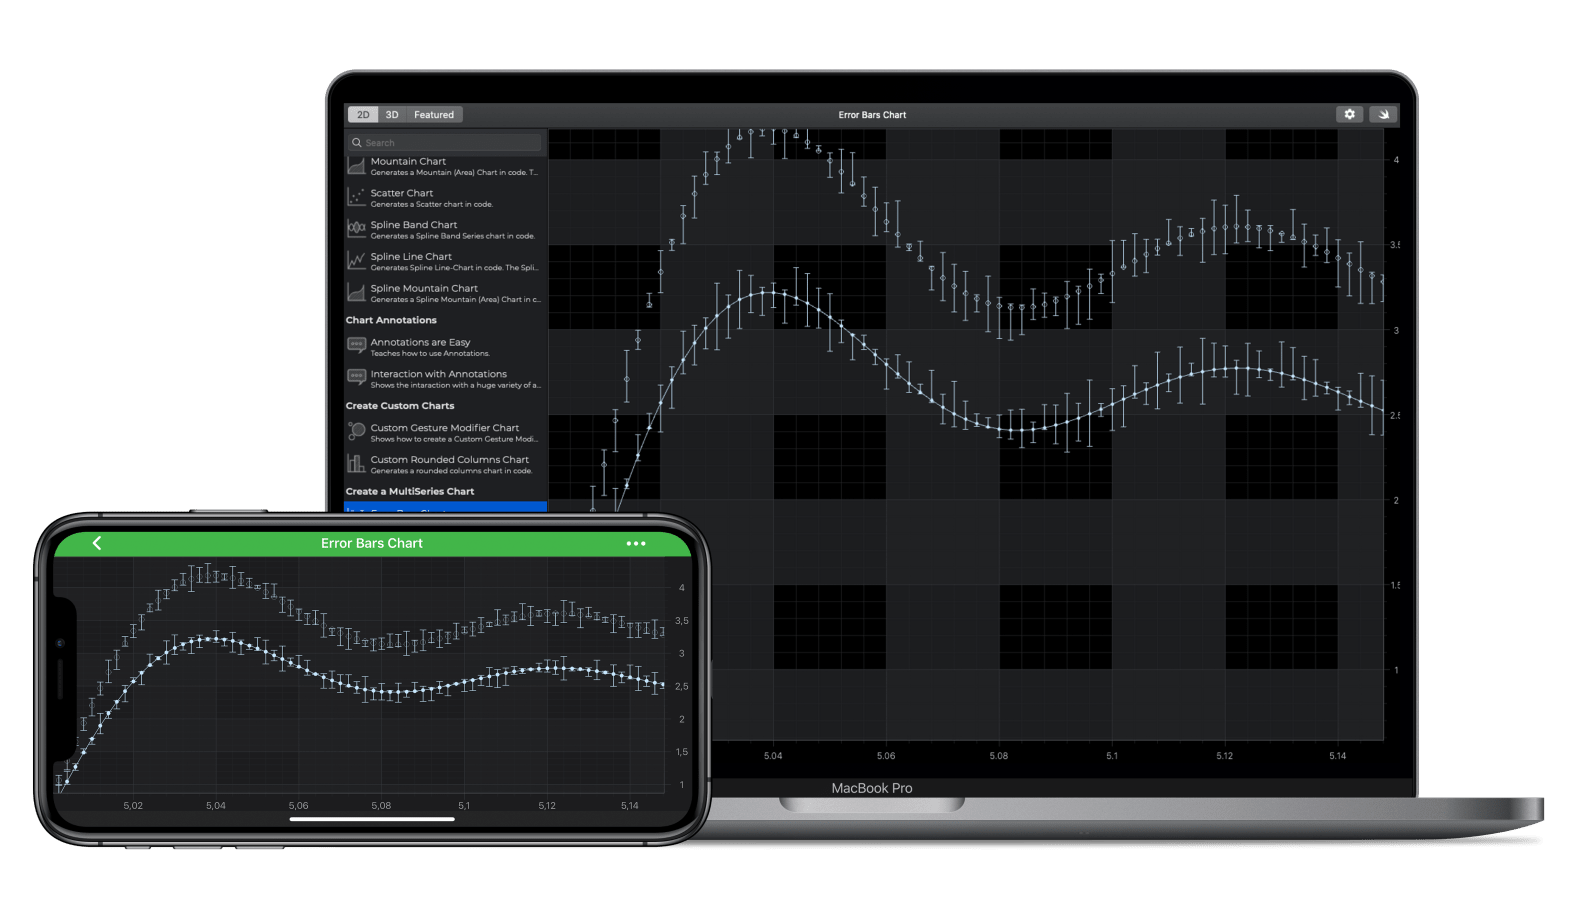
Demonstrates how to add Error Bars to an iOS Line or Scatter Chart.
There are two Error Bar Series Types in SciChart iOS: The SCIFastErrorBarsRenderableSeries requires an SCIHlDataSeries as data source. The High, Low values are used to set the high and low position of the errors, while the Close (Y-value) is the center of the error bar.
A second error bar type is the SCIFastFixedErrorBarsRenderableSeries . This requires only a SCIXyDataSeries with X,Y values. Error values are fixed and specified by the properties errorHigh and errorLow. The errorType property specifies whether the error is Relative or Absolute.
Tip!
Do you need to change the width of the Error Bars? Try the dataPointWidth property. This alters how much space the bar takes up.
The Swift and Objective-C source code for the iOS and macOS Error Bars Chart example is included below (Scroll down!).
Did you know that we have the source code for all our example available for free on Github?
Clone the SciChart.iOS.Examples from Github.
Also the SciChart iOS and Scichart macOS Trials contain the full source for the examples (link below).
//******************************************************************************
// SCICHART® Copyright SciChart Ltd. 2011-2019. All rights reserved.
//
// Web: http://www.scichart.com
// Support: support@scichart.com
// Sales: sales@scichart.com
//
// ErrorBarsChartView.m is part of the SCICHART® Examples. Permission is hereby granted
// to modify, create derivative works, distribute and publish any part of this source
// code whether for commercial, private or personal use.
//
// The SCICHART® examples are distributed in the hope that they will be useful, but
// without any warranty. It is provided "AS IS" without warranty of any kind, either
// expressed or implied.
//******************************************************************************
#import "ErrorBarsChartView.h"
#import "SCDDataManager.h"
@implementation ErrorBarsChartView
- (void)initExample {
SCIHlDataSeries *dataSeries0 = [[SCIHlDataSeries alloc] initWithXType:SCIDataType_Double yType:SCIDataType_Double];
SCIHlDataSeries *dataSeries1 = [[SCIHlDataSeries alloc] initWithXType:SCIDataType_Double yType:SCIDataType_Double];
SCDDoubleSeries *data = [SCDDataManager getFourierSeriesWithAmplitude:1.0 phaseShift:0.1 xStart:5.0 xEnd:5.15 count:5000];
[self fillSeries:dataSeries0 sourceData:data scale:1.0];
[self fillSeries:dataSeries1 sourceData:data scale:1.3];
uint color = 0xFFC6E6FF;
SCIEllipsePointMarker *pMarker = [SCIEllipsePointMarker new];
pMarker.size = CGSizeMake(5, 5);
pMarker.fillStyle = [[SCISolidBrushStyle alloc] initWithColorCode:color];
SCIFastLineRenderableSeries *lineSeries = [SCIFastLineRenderableSeries new];
lineSeries.dataSeries = dataSeries0;
lineSeries.pointMarker = pMarker;
lineSeries.strokeStyle = [[SCISolidPenStyle alloc] initWithColorCode:color thickness:1.f];
self.errorBars0 = [SCIFastErrorBarsRenderableSeries new];
self.errorBars0.dataSeries = dataSeries0;
self.errorBars0.strokeStyle = [[SCISolidPenStyle alloc] initWithColorCode:color thickness:self.strokeThickness];
self.errorBars0.errorDirection = SCIErrorDirection_Vertical;
self.errorBars0.errorType = SCIErrorType_Absolute;
self.errorBars0.dataPointWidth = self.dataPointWidth;
self.errorBars1 = [SCIFastErrorBarsRenderableSeries new];
self.errorBars1.dataSeries = dataSeries1;
self.errorBars1.strokeStyle = [[SCISolidPenStyle alloc] initWithColorCode:color thickness:self.strokeThickness];
self.errorBars1.errorDirection = SCIErrorDirection_Vertical;
self.errorBars1.errorType = SCIErrorType_Absolute;
self.errorBars1.dataPointWidth = self.dataPointWidth;
SCIEllipsePointMarker *sMarker = [SCIEllipsePointMarker new];
sMarker.size = CGSizeMake(7, 7);
sMarker.fillStyle = [[SCISolidBrushStyle alloc] initWithColorCode:0x00FFFFFF];
sMarker.strokeStyle = [[SCISolidPenStyle alloc] initWithColorCode:color thickness:1];
SCIXyScatterRenderableSeries *scatterSeries = [SCIXyScatterRenderableSeries new];
scatterSeries.dataSeries = dataSeries1;
scatterSeries.pointMarker = sMarker;
[SCIUpdateSuspender usingWithSuspendable:self.surface withBlock:^{
[self.surface.xAxes add:[SCINumericAxis new]];
[self.surface.yAxes add:[SCINumericAxis new]];
[self.surface.renderableSeries addAll:lineSeries, scatterSeries, self.errorBars0, self.errorBars1, nil];
[self.surface.chartModifiers add:[SCDExampleBaseViewController createDefaultModifiers]];
[SCIAnimations scaleSeries:lineSeries duration:3.0 andEasingFunction:[SCIElasticEase new]];
[SCIAnimations scaleSeries:scatterSeries duration:3.0 andEasingFunction:[SCIElasticEase new]];
[SCIAnimations scaleSeries:self.errorBars0 duration:3.0 andEasingFunction:[SCIElasticEase new]];
[SCIAnimations scaleSeries:self.errorBars1 duration:3.0 andEasingFunction:[SCIElasticEase new]];
}];
}
- (void)fillSeries:(id<ISCIHlDataSeries>)dataSeries sourceData:(SCDDoubleSeries *)sourceData scale:(double)scale {
SCIDoubleValues *xValues = sourceData.xValues;
SCIDoubleValues *yValues = sourceData.yValues;
SCIDoubleValues *highValues = [SCIDoubleValues new];
SCIDoubleValues *lowValues = [SCIDoubleValues new];
for (int i = 0 ; i < yValues.count; i++) {
[yValues set:[yValues getValueAt:i] * scale at:i];
[highValues add:randf(0.0, 1.0) * 0.2];
[lowValues add:randf(0.0, 1.0) * 0.2];
}
[dataSeries appendValuesX:xValues y:yValues high:highValues low:lowValues];
}
@end
//******************************************************************************
// SCICHART® Copyright SciChart Ltd. 2011-2019. All rights reserved.
//
// Web: http://www.scichart.com
// Support: support@scichart.com
// Sales: sales@scichart.com
//
// ErrorBarsChartView.swift is part of the SCICHART® Examples. Permission is hereby granted
// to modify, create derivative works, distribute and publish any part of this source
// code whether for commercial, private or personal use.
//
// The SCICHART® examples are distributed in the hope that they will be useful, but
// without any warranty. It is provided "AS IS" without warranty of any kind, either
// expressed or implied.
//******************************************************************************
class ErrorBarsChartView: SCDErrorBarsChartViewControllerBase {
override func initExample() {
let dataSeries0 = SCIHlDataSeries(xType: .double, yType: .double)
let dataSeries1 = SCIHlDataSeries(xType: .double, yType: .double)
let data = SCDDataManager.getFourierSeries(withAmplitude: 1.0, phaseShift: 0.1, xStart: 5.0, xEnd: 5.15, count: 5000)
fillSeries(dataSeries: dataSeries0, sourceData: data, scale: 1.0)
fillSeries(dataSeries: dataSeries1, sourceData: data, scale: 1.3)
let color: uint = 0xFFC6E6FF
let pMarker = SCIEllipsePointMarker()
pMarker.size = CGSize(width: 5, height: 5)
pMarker.fillStyle = SCISolidBrushStyle(colorCode: color)
let lineSeries = SCIFastLineRenderableSeries()
lineSeries.dataSeries = dataSeries0
lineSeries.pointMarker = pMarker
lineSeries.strokeStyle = SCISolidPenStyle(colorCode: color, thickness: 1.0)
errorBars0 = SCIFastErrorBarsRenderableSeries()
errorBars0.dataSeries = dataSeries0
errorBars0.strokeStyle = SCISolidPenStyle(colorCode: color, thickness: strokeThickness)
errorBars0.errorDirection = .vertical
errorBars0.errorType = .absolute
errorBars0.dataPointWidth = dataPointWidth
errorBars1 = SCIFastErrorBarsRenderableSeries()
errorBars1.dataSeries = dataSeries1
errorBars1.strokeStyle = SCISolidPenStyle(colorCode: color, thickness: strokeThickness)
errorBars1.errorDirection = .vertical
errorBars1.errorType = .absolute
errorBars1.dataPointWidth = dataPointWidth
let sMarker = SCIEllipsePointMarker()
sMarker.size = CGSize(width: 7, height: 7)
sMarker.fillStyle = SCISolidBrushStyle(colorCode:0x00FFFFFF)
sMarker.strokeStyle = SCISolidPenStyle(colorCode: color, thickness: 1.0)
let scatterSeries = SCIXyScatterRenderableSeries()
scatterSeries.dataSeries = dataSeries1
scatterSeries.pointMarker = sMarker
SCIUpdateSuspender.usingWith(surface) {
self.surface.xAxes.add(SCINumericAxis())
self.surface.yAxes.add(SCINumericAxis())
self.surface.renderableSeries.add(items: lineSeries, scatterSeries, self.errorBars0, self.errorBars1)
self.surface.chartModifiers.add(SCDExampleBaseViewController.createDefaultModifiers())
SCIAnimations.scale(lineSeries, duration: 3.0, andEasingFunction: SCIElasticEase())
SCIAnimations.scale(scatterSeries, duration: 3.0, andEasingFunction: SCIElasticEase())
SCIAnimations.scale(self.errorBars0, duration: 3.0, andEasingFunction: SCIElasticEase())
SCIAnimations.scale(self.errorBars1, duration: 3.0, andEasingFunction: SCIElasticEase())
}
}
fileprivate func fillSeries(dataSeries: ISCIHlDataSeries, sourceData: SCDDoubleSeries, scale: Double) {
let xValues = sourceData.xValues
let yValues = sourceData.yValues
let highValues = SCIDoubleValues()
let lowValues = SCIDoubleValues()
for i in 0 ..< xValues.count {
yValues.set(yValues.getValueAt(i) * scale, at: i)
highValues.add(randf(0.0, 1.0) * 0.2)
lowValues.add(randf(0.0, 1.0) * 0.2)
}
dataSeries.append(x: xValues, y: yValues, high: highValues, low: lowValues)
}
}
//******************************************************************************
// SCICHART® Copyright SciChart Ltd. 2011-2020. All rights reserved.
//
// Web: http://www.scichart.com
// Support: support@scichart.com
// Sales: sales@scichart.com
//
// SCDErrorBarsChartViewControllerBase.m is part of the SCICHART® Examples. Permission is hereby granted
// to modify, create derivative works, distribute and publish any part of this source
// code whether for commercial, private or personal use.
//
// The SCICHART® examples are distributed in the hope that they will be useful, but
// without any warranty. It is provided "AS IS" without warranty of any kind, either
// expressed or implied.
//******************************************************************************
#import "SCDErrorBarsChartViewControllerBase.h"
#import "SCDSettingsPresenter.h"
#import "SCDToolbarButtonsGroup.h"
#import "SCDToolbarItem.h"
#import "SCDConstants.h"
#import "SCDLabeledSettingsItem.h"
#import "SCDToolbarSliderItem.h"
@implementation SCDErrorBarsChartViewControllerBase {
SCDSettingsPresenter *_settingsPresenter;
}
@synthesize errorBars0 = _errorBars0;
@synthesize errorBars1 = _errorBars1;
@synthesize dataPointWidth = _dataPointWidth;
@synthesize strokeThickness = _strokeThickness;
- (Class)associatedType { return SCIChartSurface.class; }
- (BOOL)showDefaultModifiersInToolbar { return NO; }
- (void)commonInit {
_dataPointWidth = 0.5;
_strokeThickness = 1.0;
}
- (NSArray<id<ISCDToolbarItem>> *)provideExampleSpecificToolbarItems {
__weak typeof(self) wSelf = self;
SCDToolbarButtonsGroup *settingsToolbar = [[SCDToolbarButtonsGroup alloc] initWithToolbarItems:@[
[[SCDToolbarItem alloc] initWithTitle:@"ErrorBars settings" image:[SCIImage imageNamed:@"chart.settings"] andAction:^{ [wSelf p_SCD_openSettings]; }]
]];
settingsToolbar.identifier = TOOLBAR_MODIFIERS_SETTINGS;
return @[settingsToolbar];
}
- (void)p_SCD_openSettings {
_settingsPresenter = [[SCDSettingsPresenter alloc] initWithSettingsItems:[self p_SCD_createSettingsItems] andIdentifier:TOOLBAR_MODIFIERS_SETTINGS];
}
- (NSArray<id<ISCDToolbarItem>> *)p_SCD_createSettingsItems {
__weak typeof(self) wSelf = self;
SCDToolbarSliderItem *dataPointWidthItem = [[SCDToolbarSliderItem alloc] initWithSliderValue:_dataPointWidth maxValue:1.0 andAction:^(double sliderValue) {
[wSelf p_SCD_onDataPointWidthChange:sliderValue];
}];
SCDToolbarSliderItem *strokeThicknessItem = [[SCDToolbarSliderItem alloc] initWithSliderValue:_strokeThickness maxValue:2.0 andAction:^(double sliderValue) {
[wSelf p_SCD_onStrokeThicknessChange:sliderValue];
}];
return @[
[[SCDLabeledSettingsItem alloc] initWithLabelText:@"Change ErrorBars dataPointWidth" item:dataPointWidthItem iOS_orientation:SCILayoutConstraintAxisVertical],
[[SCDLabeledSettingsItem alloc] initWithLabelText:@"Change ErrorBars strokeThickness" item:strokeThicknessItem iOS_orientation:SCILayoutConstraintAxisVertical]
];
}
- (void)p_SCD_onDataPointWidthChange:(double)sliderValue {
_dataPointWidth = sliderValue;
self.errorBars0.dataPointWidth = _dataPointWidth;
self.errorBars1.dataPointWidth = _dataPointWidth;
}
- (void)p_SCD_onStrokeThicknessChange:(double)sliderValue {
_strokeThickness = (float)sliderValue;
_errorBars0.strokeStyle = [[SCISolidPenStyle alloc] initWithColorCode:_errorBars0.strokeStyle.colorCode thickness:_strokeThickness];
_errorBars1.strokeStyle = [[SCISolidPenStyle alloc] initWithColorCode:_errorBars1.strokeStyle.colorCode thickness:_strokeThickness];
}
@end