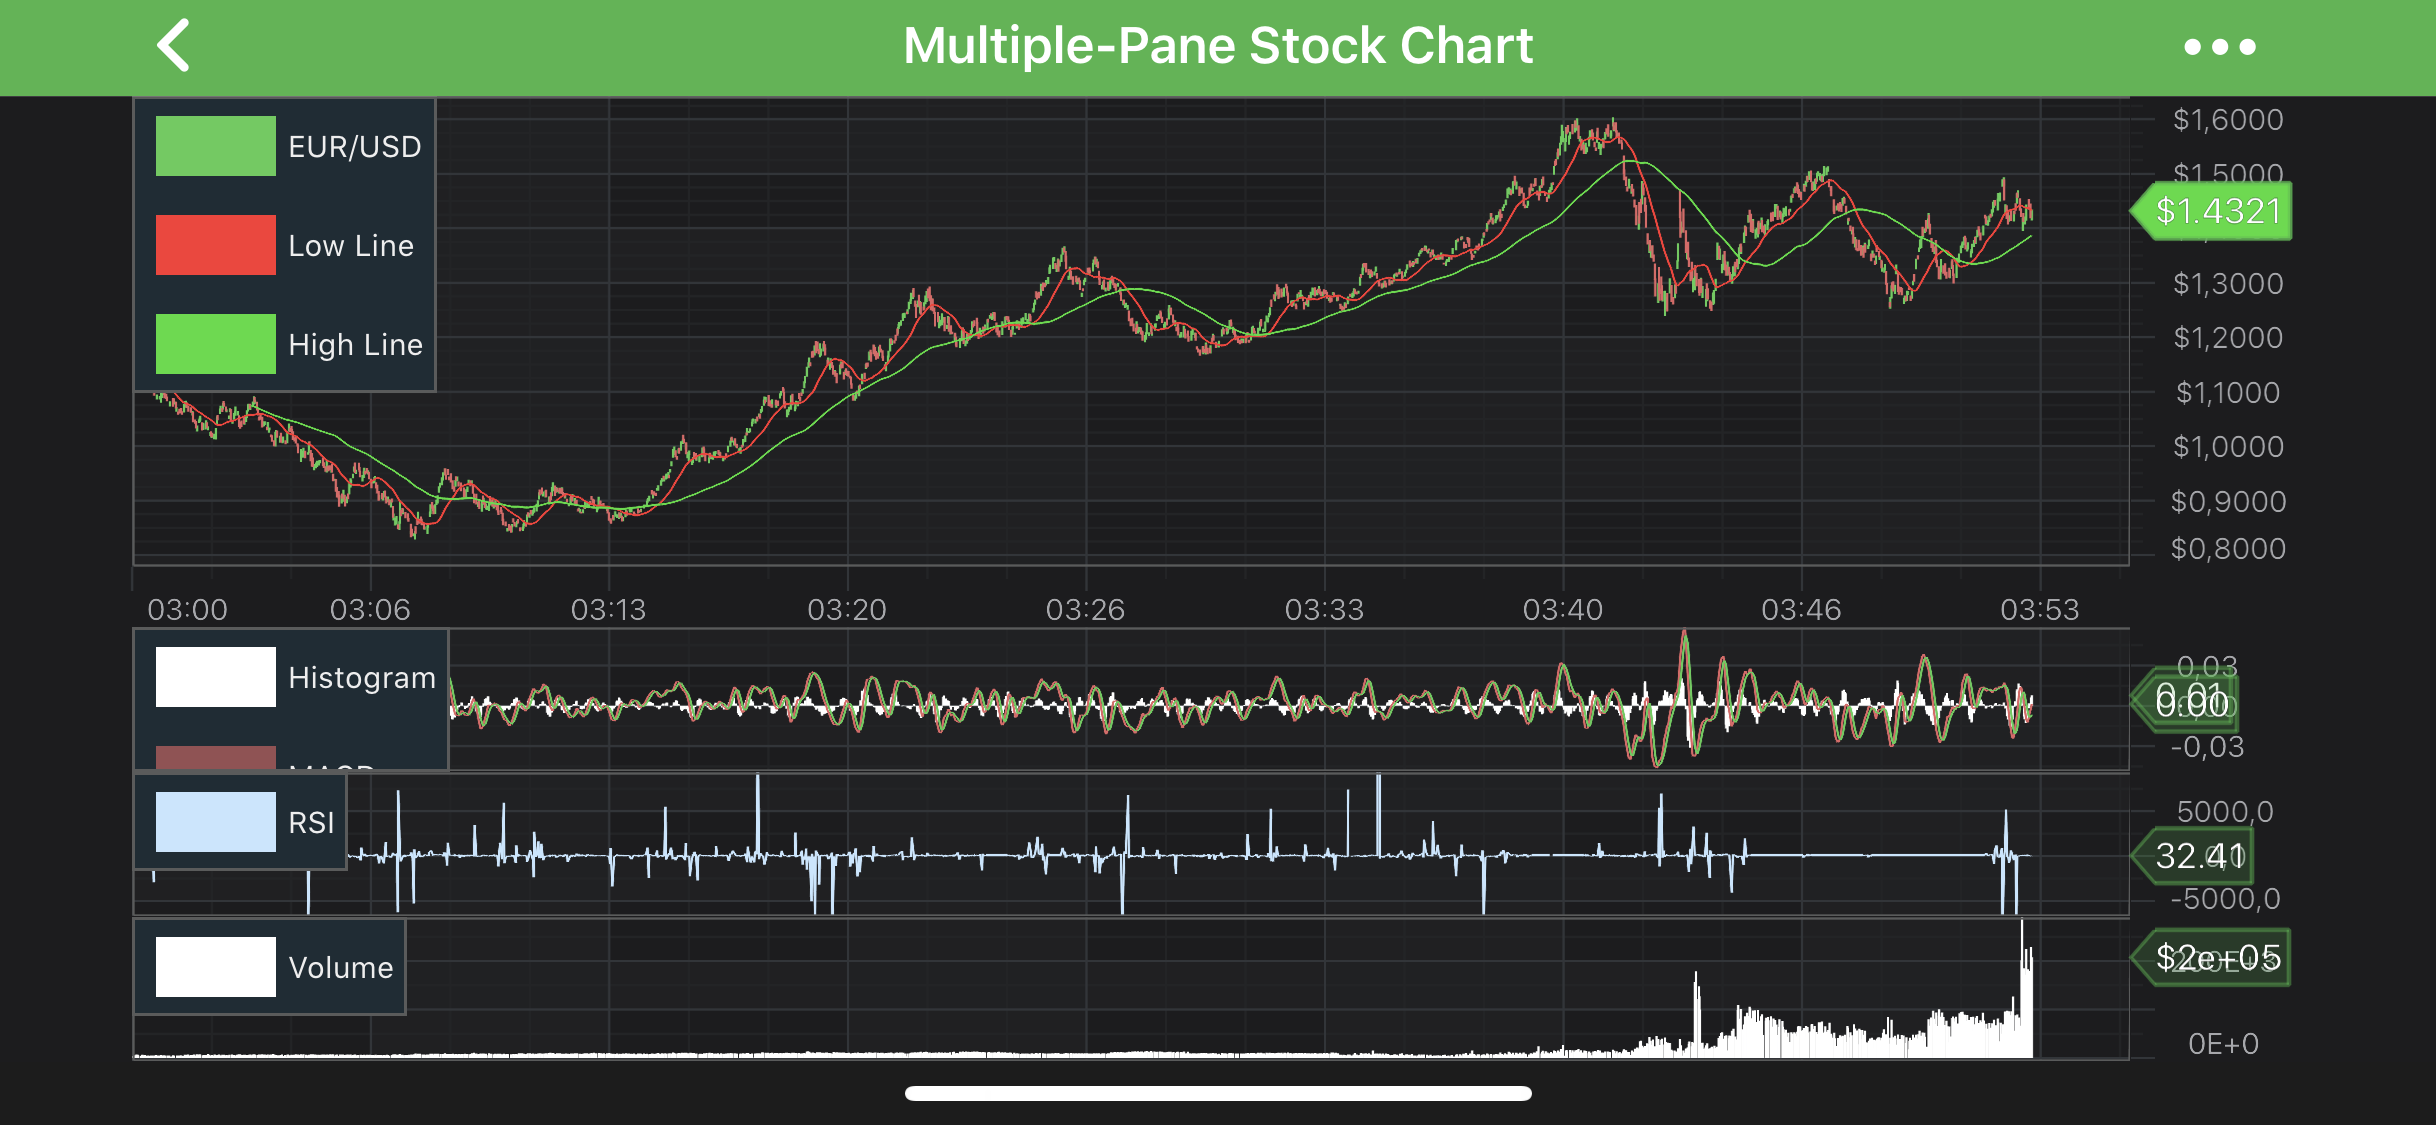
In our series of tutorials, up until now we have added a chart with two Y-Axis, one X-Axis, two series, added tooltips, legends and zooming, panning behavior, and added some annotations. All of that was with the only SCIChartSurface.
In SciChart, there is no restriction on the number of SCIChartSurface you can have in an application.
In the previous tutorial - Multiple Axis - we’ve manipulated one SCIChartSurface instance.
In this tutorial you will learn how to:
add a secondSCIChartSurface (or potentially unlimited surfaces).
link multiple charts and modifiers on them together
Getting Started
This tutorial is suitable for Objective-C, Swift and C# with Xamarin.iOS.
NOTE: Source code for this tutorial can be found at our Github Repository:
Assuming, you’ve already know how to add one SCIChartSurface, it should be fairly easy to add second surface.
Just repeat the same procedure to configure the second chart. We will leave off annotations and modifiers.
Everything else will be the same.
The code below shows how to add two SCIChartSurface instance into one view:
public SCIChartSurface Surface { get; } = new SCIChartSurface { TranslatesAutoresizingMaskIntoConstraints = false };
public SCIChartSurface Surface2 { get; } = new SCIChartSurface { TranslatesAutoresizingMaskIntoConstraints = false };
// …
public override void LoadView()
{
View = new UIView();
View.AddSubviews(Surface, Surface2);
var objects = new NSObject[] { Surface, Surface2 };
var keys = new NSObject[] { new NSString(“SciChart1”), new NSString(“SciChart2”) };
var layoutDictionary = NSDictionary.FromObjectsAndKeys(objects, keys);
View.AddConstraints(NSLayoutConstraint.FromVisualFormat(“|-(0)-[SciChart1]-(0)-|”, 0, null, layoutDictionary));
View.AddConstraints(NSLayoutConstraint.FromVisualFormat(“|-(0)-[SciChart2]-(0)-|”, 0, null, layoutDictionary));
View.AddConstraints(NSLayoutConstraint.FromVisualFormat(“V:|-(0)-[SciChart1(SciChart2)]-(0)-[SciChart2(SciChart1)]-(0)-|”, 0, null, layoutDictionary));
}
NOTE: You might want to add your Surfaces from the .storyboard or .xib or whatever else. Constrains in visual format is just for the sake of simplicity.
Now, let’s add Axes onto a Surfaces as we did before, the only difference - we extracted some code to omit duplications:
We are going to attach an existing DataSeries instance, so it scrolls just like the series on the first chart.
Also, we will attach the RenderableSeries to the right axis.
NOTE: Remember, since there are two Y-Axes, they both must have unique IDs assigned to them. Those IDs can be used to register RenderableSeries and Annotations on a corresponding axis.
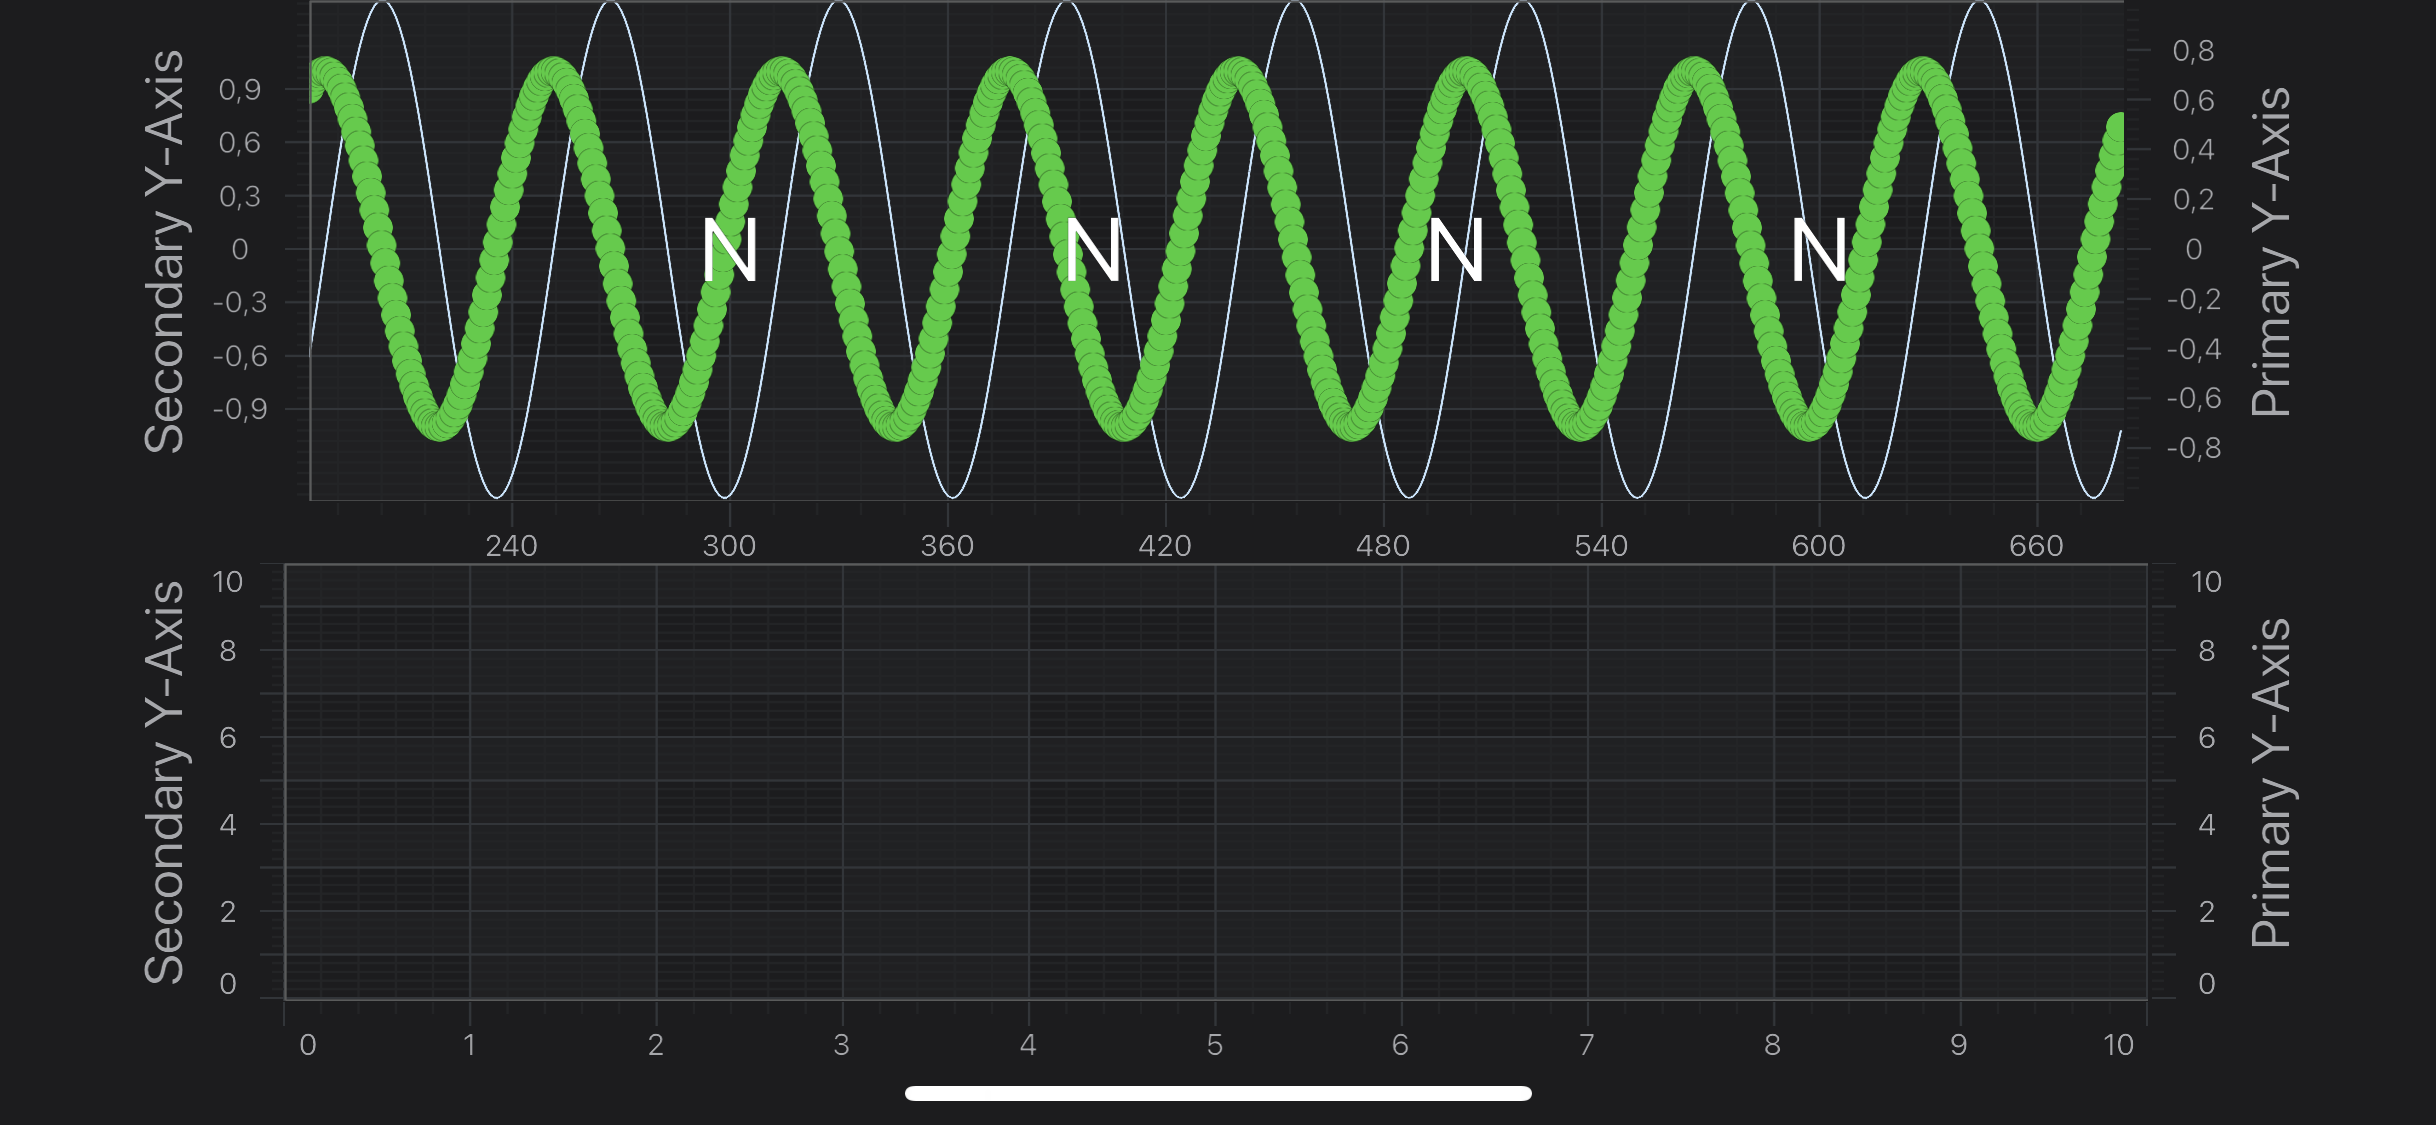
In SciChart, you can synchronize VisibleRanges, chart Sizes, Modifiers, tooltips and more!
Synchronizing VisibleRanges on Axes
To make both charts show the same VisibleRanges on both axes, you share the same ISCIRange instance across the axes.
In this particular case, there is no need to do that because both charts use the same data. But if it was different, we would need to synchronize VisibleRanges like this:
// Create an ISCIRange instance that will be shared across multiple charts
SCIDoubleRange *sharedXRange = [SCIDoubleRange new];
// Create an X axis and apply sharedXRange
SCINumericAxis *xAxis = SCINumericAxis()
xAxis.visibleRange = sharedXRange;
// Create another X axis and apply sharedXRange
SCINumericAxis *xAxis2 = SCINumericAxis()
xAxis2.visibleRange = sharedXRange;
// Create an ISCIRange instance that will be shared across multiple charts
let sharedXRange = SCIDoubleRange()
// Create an X axis and apply sharedXRange
let xAxis = SCINumericAxis()
xAxis.visibleRange = sharedXRange
// Create another X axis and apply sharedXRange
let xAxis2 = SCINumericAxis()
xAxis2.visibleRange = sharedXRange
// Create an ISCIRange instance that will be shared across multiple charts
var sharedXRange = new SCIDoubleRange();
// Create an X axis and apply sharedXRange
var xAxis = new SCINumericAxis();
xAxis.VisibleRange = sharedXRange;
// Create another X axis and apply sharedXRange
var xAxis2 = new SCINumericAxis();
xAxis2.VisibleRange = sharedXRange;
Synchronizing Chart Widths
Imagine a situation when you have a two charts with Y axes on opposite sides, or values on your Y-Axes differs, and width of them are different.
It will cause one of the chart areas stick out. There is a helper class called SCIChartVerticalGroup which is used in situations like this.
It’s just line charts up. See the code below which showcases how to use it:
The first chart has an array of ChartModifiers set up to handle zooming, panning and tooltips.
We are going to add some of these modifiers to the second chart.
To sync those modifier, you should add the modifiers through the SCIModifierGroup collection, and share the same group via the SCIModifierGroup.eventGroup property, like showcased below:
Finally, start exploring. The SciChart iOS is quite extensive.
You can look into our SciChart iOS Examples Suite which are full of 2D and 3D examples, which are also available on our GitHub.
 View on GitHub