SciChart® the market leader in Fast WPF Charts, WPF 3D Charts, iOS Chart, Android Chart and JavaScript Chart Components
Please note! These examples are new to SciChart iOS v4 release! SciChart’s OpenGL ES and Metal iOS and Metal macOS Chart library ships with hundred of Objective-C and Swift iOS&macOS Chart Examples which you can browse, play with and view the source-code. All of this is possible with the new and improved SciChart iOS Examples Suite and demo application for Mac, which ships as part of the SciChart SDK.
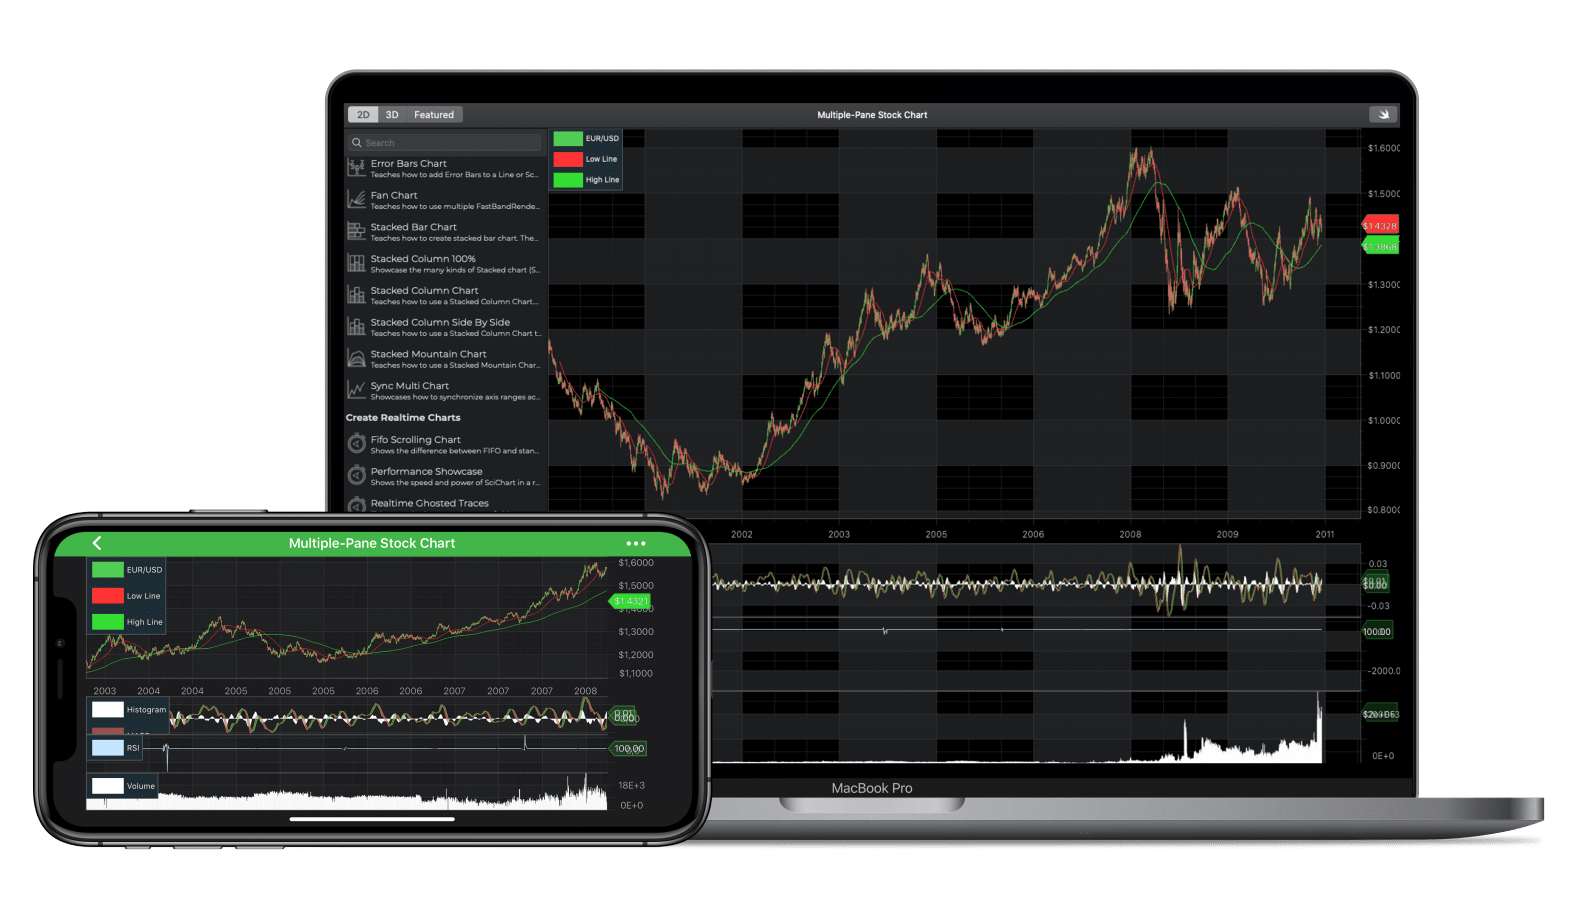
The iOS Create Multi Pane Stock Charts example demonstrates how SciChart iOS is suitable for creating complex, multi-panel stock chart and trading apps, able to display indicators on the main pane, in panels and synchronize the zooming, scrolling of multiple charts together.
An Ohlc or Candlestick chart is added by using SciChart’s SCIFastCandlestickRenderableSeries or SCIFastOhlcRenderableSeries respectively. Two line series using SCIFastLineRenderableSeries draw the moving averages.
Price data is updated in a SCIOhlcDataSeries in a timer callback. When the data updates, SciChart automatically redraws. Scrolling to the latest bar is handled in code by manipulating the Axis.VisibleRange property.
Technical Indicators are for demonstration purposes only. We recommend the open-source TA-Lib to integrate technical indicators to SciChart!
The Swift and Objective-C source code for the iOS and macOS Multi-Panel Stock Chartexample is included below (Scroll down!).
Did you know that we have the source code for all our example available for free on Github?
Clone the SciChart.iOS.Examples from Github.
Also the SciChart iOS and Scichart macOS Trials contain the full source for the examples (link below).
//******************************************************************************
// SCICHART® Copyright SciChart Ltd. 2011-2019. All rights reserved.
//
// Web: http://www.scichart.com
// Support: support@scichart.com
// Sales: sales@scichart.com
//
// MultiPaneStockChartView.m is part of the SCICHART® Examples. Permission is hereby granted
// to modify, create derivative works, distribute and publish any part of this source
// code whether for commercial, private or personal use.
//
// The SCICHART® examples are distributed in the hope that they will be useful, but
// without any warranty. It is provided "AS IS" without warranty of any kind, either
// expressed or implied.
//******************************************************************************
#import "MultiPaneStockChartView.h"
#import "SCDDataManager.h"
#import "SCDMovingAverage.h"
NSString * const VOLUME = @"Volume";
NSString * const PRICES = @"Prices";
NSString * const RSI = @"RSI";
NSString * const MACD = @"MACD";
// MARK: - Chart Panes Interfaces
@interface BasePaneModel : NSObject
@property (nonatomic) SCIRenderableSeriesCollection *renderableSeries;
@property (nonatomic) SCIAnnotationCollection *annotations;
@property (nonatomic) SCINumericAxis *yAxis;
@property (nonatomic) NSString *title;
- (instancetype)initWithTitle:(NSString *)title yAxisTextFormatting:(NSString *)yAxisTextFormatting isFirstPane:(BOOL)isFirstPane;
- (void)addRenderableSeries:(SCIRenderableSeriesBase *)renderableSeries;
@end
@interface PricePaneModel : BasePaneModel
- (instancetype)initWithSeries:(SCDPriceSeries *)priceSeries;
@end
@interface VolumePaneModel : BasePaneModel
- (instancetype)initWithSeries:(SCDPriceSeries *)priceSeries;
@end
@interface RsiPaneModel : BasePaneModel
- (instancetype)initWithSeries:(SCDPriceSeries *)priceSeries;
@end
@interface MacdPaneModel : BasePaneModel
- (instancetype)initWithSeries:(SCDPriceSeries *)priceSeries;
@end
// MARK: - Charts Initialization
@implementation MultiPaneStockChartView {
SCIChartVerticalGroup *_verticalGroup;
SCIDoubleRange *_sharedXRange;
}
- (BOOL)showDefaultModifiersInToolbar { return NO; }
- (void)initExample {
_verticalGroup = [SCIChartVerticalGroup new];
_sharedXRange = [SCIDoubleRange new];
SCDPriceSeries *priceSeries = [SCDDataManager getPriceDataEurUsd];
PricePaneModel *pricePaneModel = [[PricePaneModel alloc] initWithSeries:priceSeries];
MacdPaneModel *macdPaneModel = [[MacdPaneModel alloc] initWithSeries:priceSeries];
RsiPaneModel *rsiPaneModel = [[RsiPaneModel alloc] initWithSeries:priceSeries];
VolumePaneModel *volumePaneModel = [[VolumePaneModel alloc] initWithSeries:priceSeries];
[self initSurface:self.priceSurface paneModel:pricePaneModel isMainPane:YES];
[self initSurface:self.macdSurface paneModel:macdPaneModel isMainPane:NO];
[self initSurface:self.rsiSurface paneModel:rsiPaneModel isMainPane:NO];
[self initSurface:self.volumeSurface paneModel:volumePaneModel isMainPane:NO];
}
- (void)initSurface:(SCIChartSurface *)surface paneModel:(BasePaneModel *)model isMainPane:(BOOL)isMainPane {
SCICategoryDateAxis *xAxis = [SCICategoryDateAxis new];
xAxis.isVisible = isMainPane;
xAxis.visibleRange = _sharedXRange;
xAxis.growBy = [[SCIDoubleRange alloc] initWithMin:0.0 max:0.05];
SCIXAxisDragModifier *xAxisDragModifier = [SCIXAxisDragModifier new];
xAxisDragModifier.dragMode = SCIAxisDragMode_Pan;
xAxisDragModifier.clipModeX = SCIClipMode_StretchAtExtents;
SCIPinchZoomModifier *pinchZoomModifier = [SCIPinchZoomModifier new];
pinchZoomModifier.direction = SCIDirection2D_XDirection;
SCILegendModifier *legendModifier = [SCILegendModifier new];
legendModifier.showCheckBoxes = NO;
[SCIUpdateSuspender usingWithSuspendable:surface withBlock:^{
[surface.xAxes add:xAxis];
[surface.yAxes add:model.yAxis];
surface.renderableSeries = model.renderableSeries;
surface.annotations = model.annotations;
[surface.chartModifiers addAll:xAxisDragModifier, pinchZoomModifier, [SCIZoomPanModifier new], [SCIZoomExtentsModifier new], legendModifier, nil];
[self->_verticalGroup addSurfaceToGroup:surface];
}];
}
@end
// MARK: - Base Chart Pane
@implementation BasePaneModel
@synthesize renderableSeries = _renderableSeries;
@synthesize annotations = _annotations;
@synthesize yAxis = _yAxis;
@synthesize title = _title;
- (instancetype)initWithTitle:(NSString *)title yAxisTextFormatting:(NSString *)yAxisTextFormatting isFirstPane:(BOOL)isFirstPane {
self = [super init];
if (self) {
_title = title;
_renderableSeries = [SCIRenderableSeriesCollection new];
_annotations = [SCIAnnotationCollection new];
_yAxis = [SCINumericAxis new];
_yAxis.axisId = title;
if (yAxisTextFormatting != nil) {
_yAxis.textFormatting = yAxisTextFormatting;
}
_yAxis.autoRange = SCIAutoRange_Always;
_yAxis.minorsPerMajor = isFirstPane ? 4 : 2;
_yAxis.maxAutoTicks = isFirstPane ? 8 : 4;
double growBy = isFirstPane ? 0.05 : 0.0;
_yAxis.growBy = [[SCIDoubleRange alloc] initWithMin:growBy max:growBy];
}
return self;
}
- (void)addRenderableSeries:(SCIRenderableSeriesBase *)renderableSeries {
[_renderableSeries add:renderableSeries];
}
- (void)addAxisMarkerAnnotationWithYAxisId:(NSString *)yAxisId format:(NSString *)format value:(id<ISCIComparable>)value color:(SCIColor *)color {
SCIAxisMarkerAnnotation *axisMarkerAnnotation = [SCIAxisMarkerAnnotation new];
axisMarkerAnnotation.yAxisId = yAxisId;
axisMarkerAnnotation.y1 = value;
axisMarkerAnnotation.coordinateMode = SCIAnnotationCoordinateMode_Absolute;
if (color != nil) {
axisMarkerAnnotation.backgroundBrush = [[SCISolidBrushStyle alloc] initWithColor:color];
}
axisMarkerAnnotation.formattedValue = [NSString stringWithFormat: format, value.toDouble];
[_annotations add:axisMarkerAnnotation];
}
@end
// MARK: - Price Pane
@implementation PricePaneModel
- (instancetype)initWithSeries:(SCDPriceSeries *)prices {
self = [super initWithTitle:PRICES yAxisTextFormatting:@"$0.0000" isFirstPane:YES];
if (self) {
// Add the main OHLC chart
SCIOhlcDataSeries *stockPrices = [[SCIOhlcDataSeries alloc] initWithXType:SCIDataType_Date yType:SCIDataType_Double];
stockPrices.seriesName = @"EUR/USD";
[stockPrices appendValuesX:prices.dateData open:prices.openData high:prices.highData low:prices.lowData close:prices.closeData];
SCIFastCandlestickRenderableSeries *candlestickSeries = [SCIFastCandlestickRenderableSeries new];
candlestickSeries.dataSeries = stockPrices;
candlestickSeries.yAxisId = PRICES;
[self addRenderableSeries:candlestickSeries];
SCIXyDataSeries *maLow = [[SCIXyDataSeries alloc] initWithXType:SCIDataType_Date yType:SCIDataType_Double];
maLow.seriesName = @"Low Line";
[maLow appendValuesX:prices.dateData y:[SCDMovingAverage movingAverage:prices.closeData period:50]];
SCIFastLineRenderableSeries *lineSeriesLow = [SCIFastLineRenderableSeries new];
lineSeriesLow.dataSeries = maLow;
lineSeriesLow.yAxisId = PRICES;
lineSeriesLow.strokeStyle = [[SCISolidPenStyle alloc] initWithColorCode:0xFFFF3333 thickness:1];
[self addRenderableSeries:lineSeriesLow];
SCIXyDataSeries *maHigh = [[SCIXyDataSeries alloc] initWithXType:SCIDataType_Date yType:SCIDataType_Double];
maHigh.seriesName = @"High Line";
[maHigh appendValuesX:prices.dateData y:[SCDMovingAverage movingAverage:prices.closeData period:200]];
SCIFastLineRenderableSeries *lineSeriesHigh = [SCIFastLineRenderableSeries new];
lineSeriesHigh.dataSeries = maHigh;
lineSeriesHigh.yAxisId = PRICES;
lineSeriesHigh.strokeStyle = [[SCISolidPenStyle alloc] initWithColorCode:0xFF33DD33 thickness:1];
[self addRenderableSeries:lineSeriesHigh];
[self addAxisMarkerAnnotationWithYAxisId:PRICES format:@"$%.4f" value:[stockPrices.yValues valueAt:stockPrices.count - 1] color:lineSeriesLow.strokeStyle.color];
[self addAxisMarkerAnnotationWithYAxisId:PRICES format:@"$%.4f" value:[maLow.yValues valueAt:maLow.count - 1] color:lineSeriesLow.strokeStyle.color];
[self addAxisMarkerAnnotationWithYAxisId:PRICES format:@"$%.4f" value:[maHigh.yValues valueAt:maHigh.count - 1] color:lineSeriesHigh.strokeStyle.color];
}
return self;
}
@end
// MARK: - Volume Pane
@implementation VolumePaneModel
- (instancetype)initWithSeries:(SCDPriceSeries *)prices {
self = [super initWithTitle:VOLUME yAxisTextFormatting:@"###E+0" isFirstPane:NO];
if (self) {
SCIXyDataSeries *volumePrices = [[SCIXyDataSeries alloc] initWithXType:SCIDataType_Date yType:SCIDataType_Long];
volumePrices.seriesName = @"Volume";
[volumePrices appendValuesX:prices.dateData y:prices.volumeData];
SCIFastColumnRenderableSeries *columnSeries = [SCIFastColumnRenderableSeries new];
columnSeries.dataSeries = volumePrices;
columnSeries.yAxisId = VOLUME;
[self addRenderableSeries:columnSeries];
[self addAxisMarkerAnnotationWithYAxisId:VOLUME format:@"$%.g" value:[volumePrices.yValues valueAt:volumePrices.count - 1] color:nil];
}
return self;
}
@end
// MARK: - RSI Pane
@implementation RsiPaneModel
- (instancetype)initWithSeries:(SCDPriceSeries *)prices {
self = [super initWithTitle:RSI yAxisTextFormatting:@"0.0" isFirstPane:NO];
if (self) {
SCIXyDataSeries *rsiDataSeries = [[SCIXyDataSeries alloc] initWithXType:SCIDataType_Date yType:SCIDataType_Double];
rsiDataSeries.seriesName = @"RSI";
[rsiDataSeries appendValuesX:prices.dateData y:[SCDMovingAverage rsi:prices period:14]];
SCIFastLineRenderableSeries *lineSeries = [SCIFastLineRenderableSeries new];
lineSeries.dataSeries = rsiDataSeries;
lineSeries.yAxisId = RSI;
lineSeries.strokeStyle = [[SCISolidPenStyle alloc] initWithColorCode:0xFFC6E6FF thickness:1];
[self addRenderableSeries:lineSeries];
[self addAxisMarkerAnnotationWithYAxisId:RSI format:@"%.2f" value:[rsiDataSeries.yValues valueAt:rsiDataSeries.count - 1] color:nil];
}
return self;
}
@end
// MARK: - MACD Pane
@implementation MacdPaneModel
- (instancetype)initWithSeries:(SCDPriceSeries *)prices {
self = [super initWithTitle:MACD yAxisTextFormatting:@"0.00" isFirstPane:NO];
if (self) {
SCDMacdPoints *macdPoints = [SCDMovingAverage macd:prices.closeData slow:12 fast:25 signal:9];
SCIXyDataSeries *histogramDataSeries = [[SCIXyDataSeries alloc] initWithXType:SCIDataType_Date yType:SCIDataType_Double];
histogramDataSeries.seriesName = @"Histogram";
[histogramDataSeries appendValuesX:prices.dateData y:macdPoints.divergenceValues];
SCIFastColumnRenderableSeries *columnSeries = [SCIFastColumnRenderableSeries new];
columnSeries.dataSeries = histogramDataSeries;
columnSeries.yAxisId = MACD;
[self addRenderableSeries:columnSeries];
SCIXyyDataSeries *macdDataSeries = [[SCIXyyDataSeries alloc] initWithXType:SCIDataType_Date yType:SCIDataType_Double];
macdDataSeries.seriesName = @"MACD";
[macdDataSeries appendValuesX:prices.dateData y:macdPoints.macdValues y1:macdPoints.signalValues];
SCIFastBandRenderableSeries *bandSeries = [SCIFastBandRenderableSeries new];
bandSeries.dataSeries = macdDataSeries;
bandSeries.yAxisId = MACD;
[self addRenderableSeries:bandSeries];
[self addAxisMarkerAnnotationWithYAxisId:MACD format:@"$%.2f" value:[histogramDataSeries.yValues valueAt:histogramDataSeries.count - 1] color:nil];
[self addAxisMarkerAnnotationWithYAxisId:MACD format:@"$%.2f" value:[macdDataSeries.yValues valueAt:macdDataSeries.count - 1] color:nil];
}
return self;
}
@end
//******************************************************************************
// SCICHART® Copyright SciChart Ltd. 2011-2019. All rights reserved.
//
// Web: http://www.scichart.com
// Support: support@scichart.com
// Sales: sales@scichart.com
//
// MultiPaneStockChartView.swift is part of the SCICHART® Examples. Permission is hereby granted
// to modify, create derivative works, distribute and publish any part of this source
// code whether for commercial, private or personal use.
//
// The SCICHART® examples are distributed in the hope that they will be useful, but
// without any warranty. It is provided "AS IS" without warranty of any kind, either
// expressed or implied.
//******************************************************************************
let VOLUME = "Volume";
let PRICES = "Prices";
let RSI = "RSI";
let MACD = "MACD";
// MARK: - Charts Initialization
class MultiPaneStockChartView: SCDMultiPaneStockChartViewController {
let verticalGroup = SCIChartVerticalGroup()
let sharedXRange = SCIDoubleRange()
override var showDefaultModifiersInToolbar: Bool { return false }
override func initExample() {
let SCDPriceSeries = SCDDataManager.getPriceDataEurUsd()
let pricePaneModel = PricePaneModel(prices: SCDPriceSeries)
let macdPaneModel = MacdPaneModel(prices: SCDPriceSeries)
let rsiPaneModel = RsiPaneModel(prices: SCDPriceSeries)
let volumePaneModel = VolumePaneModel(prices: SCDPriceSeries)
initSurface(priceSurface, model: pricePaneModel, isMainPane: true)
initSurface(macdSurface, model: macdPaneModel, isMainPane: false)
initSurface(rsiSurface, model: rsiPaneModel, isMainPane: false)
initSurface(volumeSurface, model: volumePaneModel, isMainPane: false)
}
fileprivate func initSurface(_ surface: SCIChartSurface, model: BasePaneModel, isMainPane: Bool) {
let xAxis = SCICategoryDateAxis()
xAxis.isVisible = isMainPane
xAxis.visibleRange = sharedXRange
xAxis.growBy = SCIDoubleRange(min: 0.0, max: 0.05)
let xAxisDragModifier = SCIXAxisDragModifier()
xAxisDragModifier.dragMode = .pan
xAxisDragModifier.clipModeX = .stretchAtExtents
let pinchZoomModifier = SCIPinchZoomModifier()
pinchZoomModifier.direction = .xDirection
let legendModifier = SCILegendModifier()
legendModifier.showCheckBoxes = false
SCIUpdateSuspender.usingWith(surface) {
surface.xAxes.add(xAxis)
surface.yAxes.add(model.yAxis)
surface.renderableSeries = model.renderableSeries
surface.annotations = model.annotations
surface.chartModifiers.add(items: xAxisDragModifier, pinchZoomModifier, SCIZoomPanModifier(), SCIZoomExtentsModifier(), legendModifier)
self.verticalGroup.addSurface(toGroup: surface)
}
}
}
// MARK: - Base Chart Pane
class BasePaneModel {
fileprivate let renderableSeries = SCIRenderableSeriesCollection()
fileprivate let annotations = SCIAnnotationCollection()
fileprivate let yAxis = SCINumericAxis()
fileprivate let title: String
init(title: String, yAxisTextFormatting: String?, isFirstPane: Bool) {
self.title = title
yAxis.axisId = title
if (yAxisTextFormatting != nil) {
yAxis.textFormatting = yAxisTextFormatting
}
yAxis.autoRange = .always
yAxis.minorsPerMajor = isFirstPane ? 4 : 2
yAxis.maxAutoTicks = isFirstPane ? 8 : 4
let growBy = isFirstPane ? 0.05 : 0.0
yAxis.growBy = SCIDoubleRange(min: growBy, max: growBy)
}
func addRenderableSeries(_ renderableSeries: SCIRenderableSeriesBase) {
self.renderableSeries.add(renderableSeries)
}
func addAxisMarkerAnnotationWith(_ yAxisId: String, format: String, value: ISCIComparable, color: SCIColor?) {
let axisMarkerAnnotation = SCIAxisMarkerAnnotation()
axisMarkerAnnotation.yAxisId = yAxisId
axisMarkerAnnotation.set(y1: value.toDouble())
axisMarkerAnnotation.coordinateMode = .absolute
if let uiColor = color {
axisMarkerAnnotation.backgroundBrush = SCISolidBrushStyle(color: uiColor)
}
axisMarkerAnnotation.fontStyle = SCIFontStyle(fontSize: 12, andTextColor: .white)
axisMarkerAnnotation.formattedValue = String(format: format, value.toDouble())
annotations.add(axisMarkerAnnotation)
}
}
// MARK: - Price Pane
class PricePaneModel: BasePaneModel {
init(prices: SCDPriceSeries) {
super.init(title: PRICES, yAxisTextFormatting: "$0.0000", isFirstPane: true)
// Add the main OHLC chart
let stockPrices = SCIOhlcDataSeries(xType: .date, yType: .double)
stockPrices.seriesName = "EUR/USD"
stockPrices.append(x: prices.dateData, open: prices.openData, high: prices.highData, low: prices.lowData, close: prices.closeData)
let candlestickSeries = SCIFastCandlestickRenderableSeries()
candlestickSeries.dataSeries = stockPrices
candlestickSeries.yAxisId = PRICES
addRenderableSeries(candlestickSeries)
let maLow = SCIXyDataSeries(xType: .date, yType: .double)
maLow.seriesName = "Low Line"
maLow.append(x: prices.dateData, y: SCDMovingAverage.movingAverage(prices.closeData, period: 50))
let lineSeriesLow = SCIFastLineRenderableSeries()
lineSeriesLow.dataSeries = maLow
lineSeriesLow.yAxisId = PRICES
lineSeriesLow.strokeStyle = SCISolidPenStyle(color: 0xFFFF3333, thickness: 1)
addRenderableSeries(lineSeriesLow)
let maHigh = SCIXyDataSeries(xType: .date, yType: .double)
maHigh.seriesName = "High Line"
maHigh.append(x: prices.dateData, y: SCDMovingAverage.movingAverage(prices.closeData, period: 200))
let lineSeriesHigh = SCIFastLineRenderableSeries()
lineSeriesHigh.dataSeries = maHigh
lineSeriesHigh.yAxisId = PRICES
lineSeriesHigh.strokeStyle = SCISolidPenStyle(color: 0xFF33DD33, thickness: 1)
addRenderableSeries(lineSeriesHigh)
addAxisMarkerAnnotationWith(PRICES, format: "$%.4f", value: stockPrices.yValues.value(at: stockPrices.count - 1), color: lineSeriesLow.strokeStyle.color)
addAxisMarkerAnnotationWith(PRICES, format: "$%.4f", value: stockPrices.yValues.value(at: maLow.count - 1), color: lineSeriesLow.strokeStyle.color)
addAxisMarkerAnnotationWith(PRICES, format: "$%.4f", value: stockPrices.yValues.value(at: maHigh.count - 1), color: lineSeriesHigh.strokeStyle.color)
}
}
// MARK: - Volume Pane
class VolumePaneModel: BasePaneModel {
init(prices: SCDPriceSeries) {
super.init(title: VOLUME, yAxisTextFormatting: "###E+0", isFirstPane: false)
let volumePrices = SCIXyDataSeries(xType: .date, yType: .long)
volumePrices.seriesName = "Volume"
volumePrices.append(x: prices.dateData, y: prices.volumeData)
let columnSeries = SCIFastColumnRenderableSeries()
columnSeries.dataSeries = volumePrices
columnSeries.yAxisId = VOLUME
addRenderableSeries(columnSeries)
addAxisMarkerAnnotationWith(VOLUME, format: "$%.g", value: volumePrices.yValues.value(at: volumePrices.count - 1), color: nil)
}
}
// MARK: - RSI Pane
class RsiPaneModel: BasePaneModel {
init(prices: SCDPriceSeries) {
super.init(title: RSI, yAxisTextFormatting: "0.0", isFirstPane: false)
let rsiDataSeries = SCIXyDataSeries(xType: .date, yType: .double)
rsiDataSeries.seriesName = "RSI"
rsiDataSeries.append(x: prices.dateData, y: SCDMovingAverage.rsi(prices, period: 14))
let lineSeries = SCIFastLineRenderableSeries()
lineSeries.dataSeries = rsiDataSeries
lineSeries.yAxisId = RSI
lineSeries.strokeStyle = SCISolidPenStyle(color: 0xFFC6E6FF, thickness: 1)
addRenderableSeries(lineSeries)
addAxisMarkerAnnotationWith(RSI, format: "%.2f", value: rsiDataSeries.yValues.value(at: rsiDataSeries.count - 1), color: nil)
}
}
// MARK: - MACD Pane
class MacdPaneModel: BasePaneModel {
init(prices: SCDPriceSeries) {
super.init(title: MACD, yAxisTextFormatting: "0.00", isFirstPane: false)
let macdPoints = SCDMovingAverage.macd(prices.closeData, slow: 12, fast: 25, signal: 9)
let histogramDataSeries = SCIXyDataSeries(xType: .date, yType: .double)
histogramDataSeries.seriesName = "Histogram"
histogramDataSeries.append(x: prices.dateData, y: macdPoints.divergenceValues)
let columnSeries = SCIFastColumnRenderableSeries()
columnSeries.dataSeries = histogramDataSeries
columnSeries.yAxisId = MACD
addRenderableSeries(columnSeries)
let macdDataSeries = SCIXyyDataSeries(xType: .date, yType: .double)
macdDataSeries.seriesName = "MACD"
macdDataSeries.append(x: prices.dateData, y: macdPoints.macdValues, y1: macdPoints.signalValues)
let bandSeries = SCIFastBandRenderableSeries()
bandSeries.dataSeries = macdDataSeries
bandSeries.yAxisId = MACD
addRenderableSeries(bandSeries)
addAxisMarkerAnnotationWith(MACD, format: "%.2f", value: histogramDataSeries.yValues.value(at: histogramDataSeries.count - 1), color: nil)
addAxisMarkerAnnotationWith(MACD, format: "%.2f", value: macdDataSeries.yValues.value(at: macdDataSeries.count - 1), color: nil)
}
}
//******************************************************************************
// SCICHART® Copyright SciChart Ltd. 2011-2020. All rights reserved.
//
// Web: http://www.scichart.com
// Support: support@scichart.com
// Sales: sales@scichart.com
//
// SCDMultiPaneStockChartViewController.m is part of the SCICHART® Examples. Permission is hereby granted
// to modify, create derivative works, distribute and publish any part of this source
// code whether for commercial, private or personal use.
//
// The SCICHART® examples are distributed in the hope that they will be useful, but
// without any warranty. It is provided "AS IS" without warranty of any kind, either
// expressed or implied.
//******************************************************************************
#import "SCDMultiPaneStockChartViewController.h"
@implementation SCDMultiPaneStockChartViewController
- (void)loadView {
[super loadView];
self.view = [SCIView new];
self.view.autoresizingMask = SCIAutoresizingFlexible;
SCIChartSurface *priceSurface = [[SCIChartSurface alloc] initWithFrame:CGRectMake(0, 0, 1, 1)];
SCIChartSurface *macdSurface = [[SCIChartSurface alloc] initWithFrame:CGRectMake(0, 0, 1, 1)];
SCIChartSurface *rsiSurface = [[SCIChartSurface alloc] initWithFrame:CGRectMake(0, 0, 1, 1)];
SCIChartSurface *volumeSurface = [[SCIChartSurface alloc] initWithFrame:CGRectMake(0, 0, 1, 1)];
for (SCIView *surface in @[priceSurface, macdSurface, rsiSurface, volumeSurface]) {
surface.translatesAutoresizingMaskIntoConstraints = NO;
[self.view addSubview:surface];
}
[self.view addConstraints:@[
[priceSurface.leadingAnchor constraintEqualToAnchor:self.view.leadingAnchor],
[priceSurface.topAnchor constraintEqualToAnchor:self.view.topAnchor],
[priceSurface.trailingAnchor constraintEqualToAnchor:self.view.trailingAnchor],
[priceSurface.bottomAnchor constraintEqualToAnchor:macdSurface.topAnchor],
[priceSurface.heightAnchor constraintEqualToAnchor:self.view.heightAnchor multiplier:0.5 constant:1],
[macdSurface.leadingAnchor constraintEqualToAnchor:priceSurface.leadingAnchor],
[macdSurface.trailingAnchor constraintEqualToAnchor:priceSurface.trailingAnchor],
[macdSurface.heightAnchor constraintEqualToAnchor:rsiSurface.heightAnchor],
[macdSurface.bottomAnchor constraintEqualToAnchor:rsiSurface.topAnchor],
[rsiSurface.leadingAnchor constraintEqualToAnchor:priceSurface.leadingAnchor],
[rsiSurface.trailingAnchor constraintEqualToAnchor:priceSurface.trailingAnchor],
[rsiSurface.heightAnchor constraintEqualToAnchor:volumeSurface.heightAnchor],
[rsiSurface.bottomAnchor constraintEqualToAnchor:volumeSurface.topAnchor],
[volumeSurface.leadingAnchor constraintEqualToAnchor:priceSurface.leadingAnchor],
[volumeSurface.trailingAnchor constraintEqualToAnchor:priceSurface.trailingAnchor],
[volumeSurface.bottomAnchor constraintEqualToAnchor:self.view.bottomAnchor]
]];
_priceSurface = priceSurface;
_macdSurface = macdSurface;
_rsiSurface = rsiSurface;
_volumeSurface = volumeSurface;
}
- (void)tryUpdateChartTheme:(SCIChartTheme)theme {
[SCIThemeManager applyTheme:theme toThemeable:self.priceSurface];
[SCIThemeManager applyTheme:theme toThemeable:self.macdSurface];
[SCIThemeManager applyTheme:theme toThemeable:self.rsiSurface];
[SCIThemeManager applyTheme:theme toThemeable:self.volumeSurface];
}
@end