 View on GitHub
iOS & macOS Charting Documentation - SciChart iOS & macOS Charts SDK v4.x
Add an Axis to a SCIChartSurface
While creating your First SciChart iOS App you’ve added axes to a SCIChartSurface. With SciChart you can also have unlimited number of axes, whether it’s left, right, top or bottom, X or Y Axes.
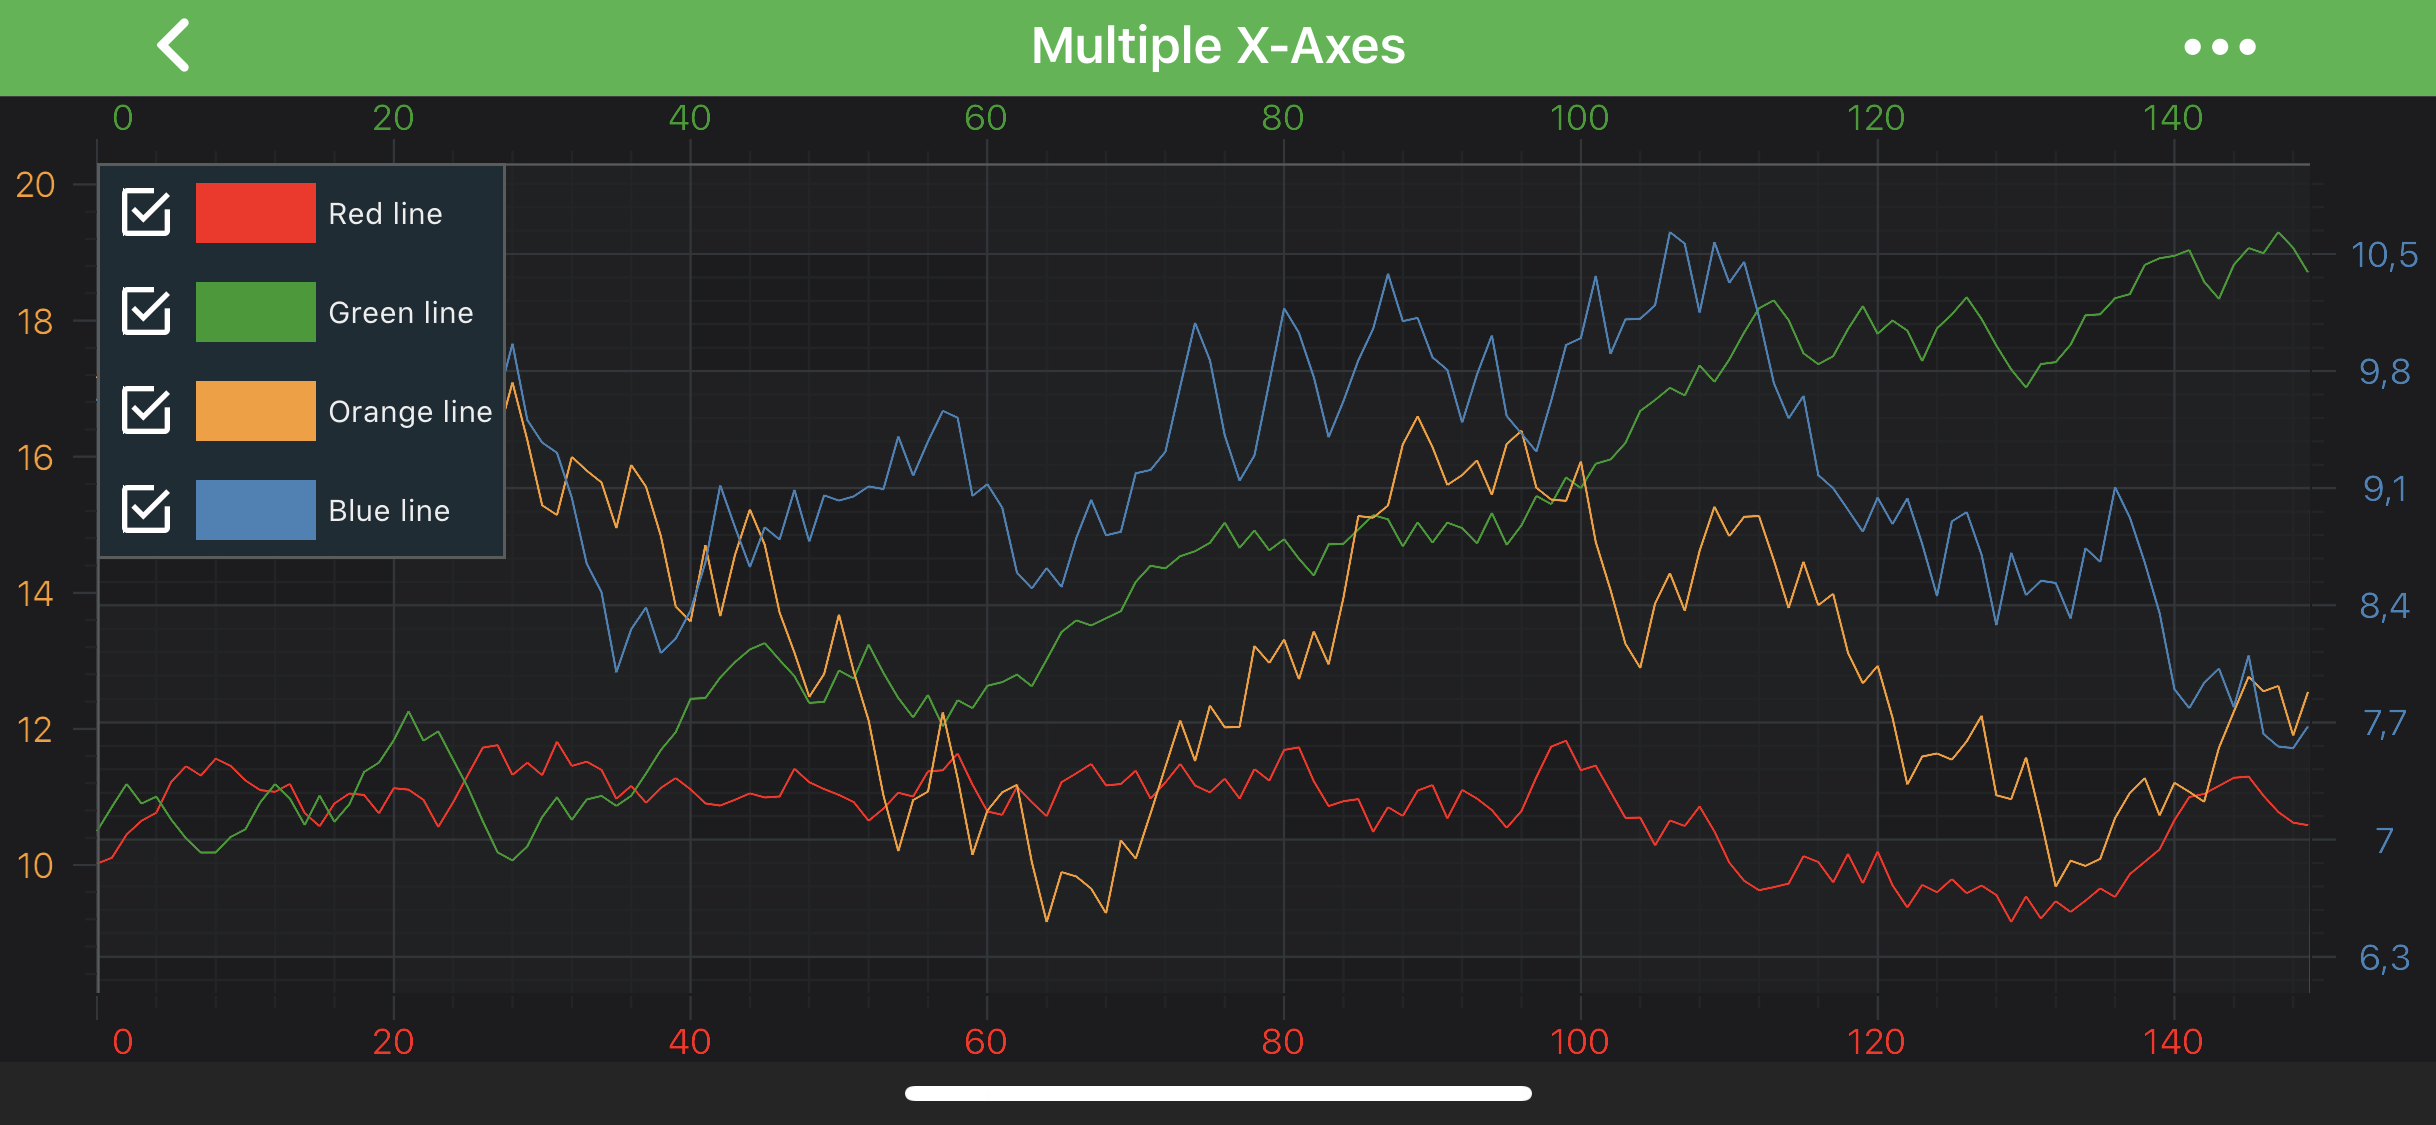
You can also place axes in the centre of the chart or swap X and Y axes over to create a vertical chart. Please see these examples from the SciChart iOS Examples Suite for reference:
Axes can be added to either the ISCIChartSurface.xAxes or ISCIChartSurface.yAxes collection of SCIChartSurface. In case of having multiple X or Y axes, every axis should have a unique ID assigned to it. All axes are positioned on a chart according to their SCIAxisAlignment.
Adding an Axis
To add X and Y axes to a SCIChartSurface, use the following code:
Similarly, you can add multiple X or Y axes to your SCIChartSurface.
NOTE: As mentioned above, every axis should have a unique ID assigned to it. By default, each axis has a
DefaultAxisIdwhich isn’t sufficient for multiple X or Y Axes.
Aligning an Axis Inside a Chart
To change the position of an axis, set SCIAxisAlignment on it:
Also, it’s possible pointing an axis inward or outward relative to the chart area. It requires setting ISCIAxis.isCenterAxis property on an axis. By default, it is set to false, thus axis labels and ticks are turned outside a chart. Setting it to true will provide the following output:
NOTE: You might want to create Vertical(Rotated) Charts, to learn more - refer to the Create a Vertical Chart article or the Vertical Chart example.
Changing Axis Direction
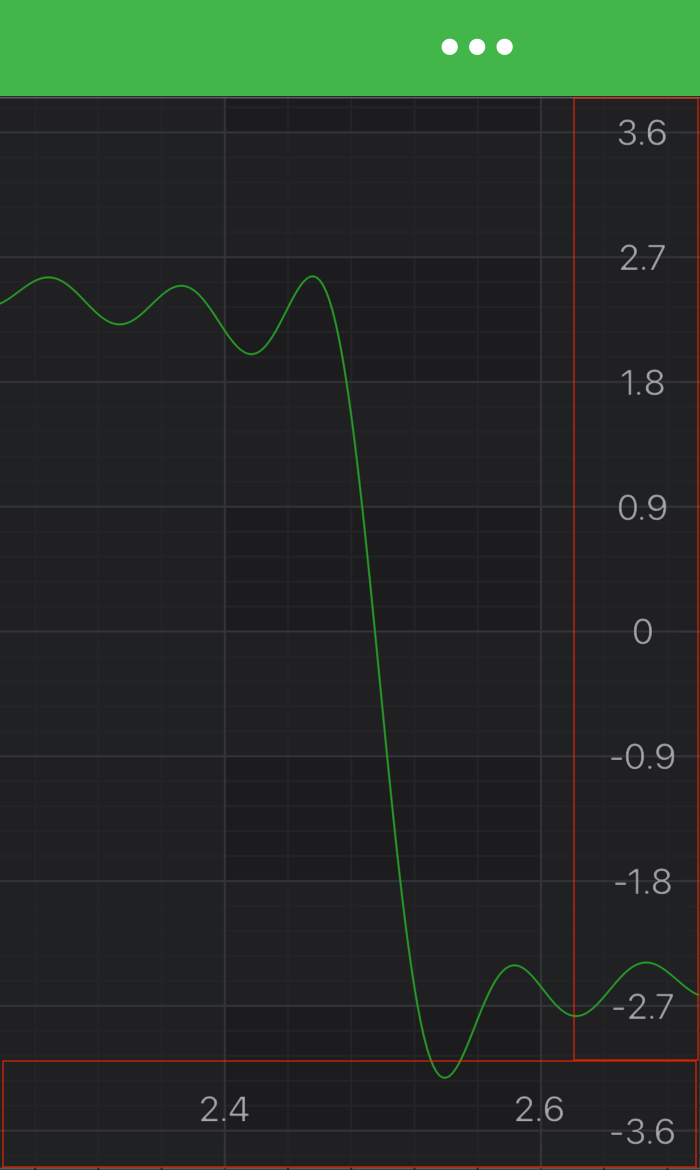
You can change Axis Direction via ISCIAxisCore.flipCoordinates property. By default it’s false. Please see the difference below:
| Default | Flipped Y Coordinates |
|---|---|
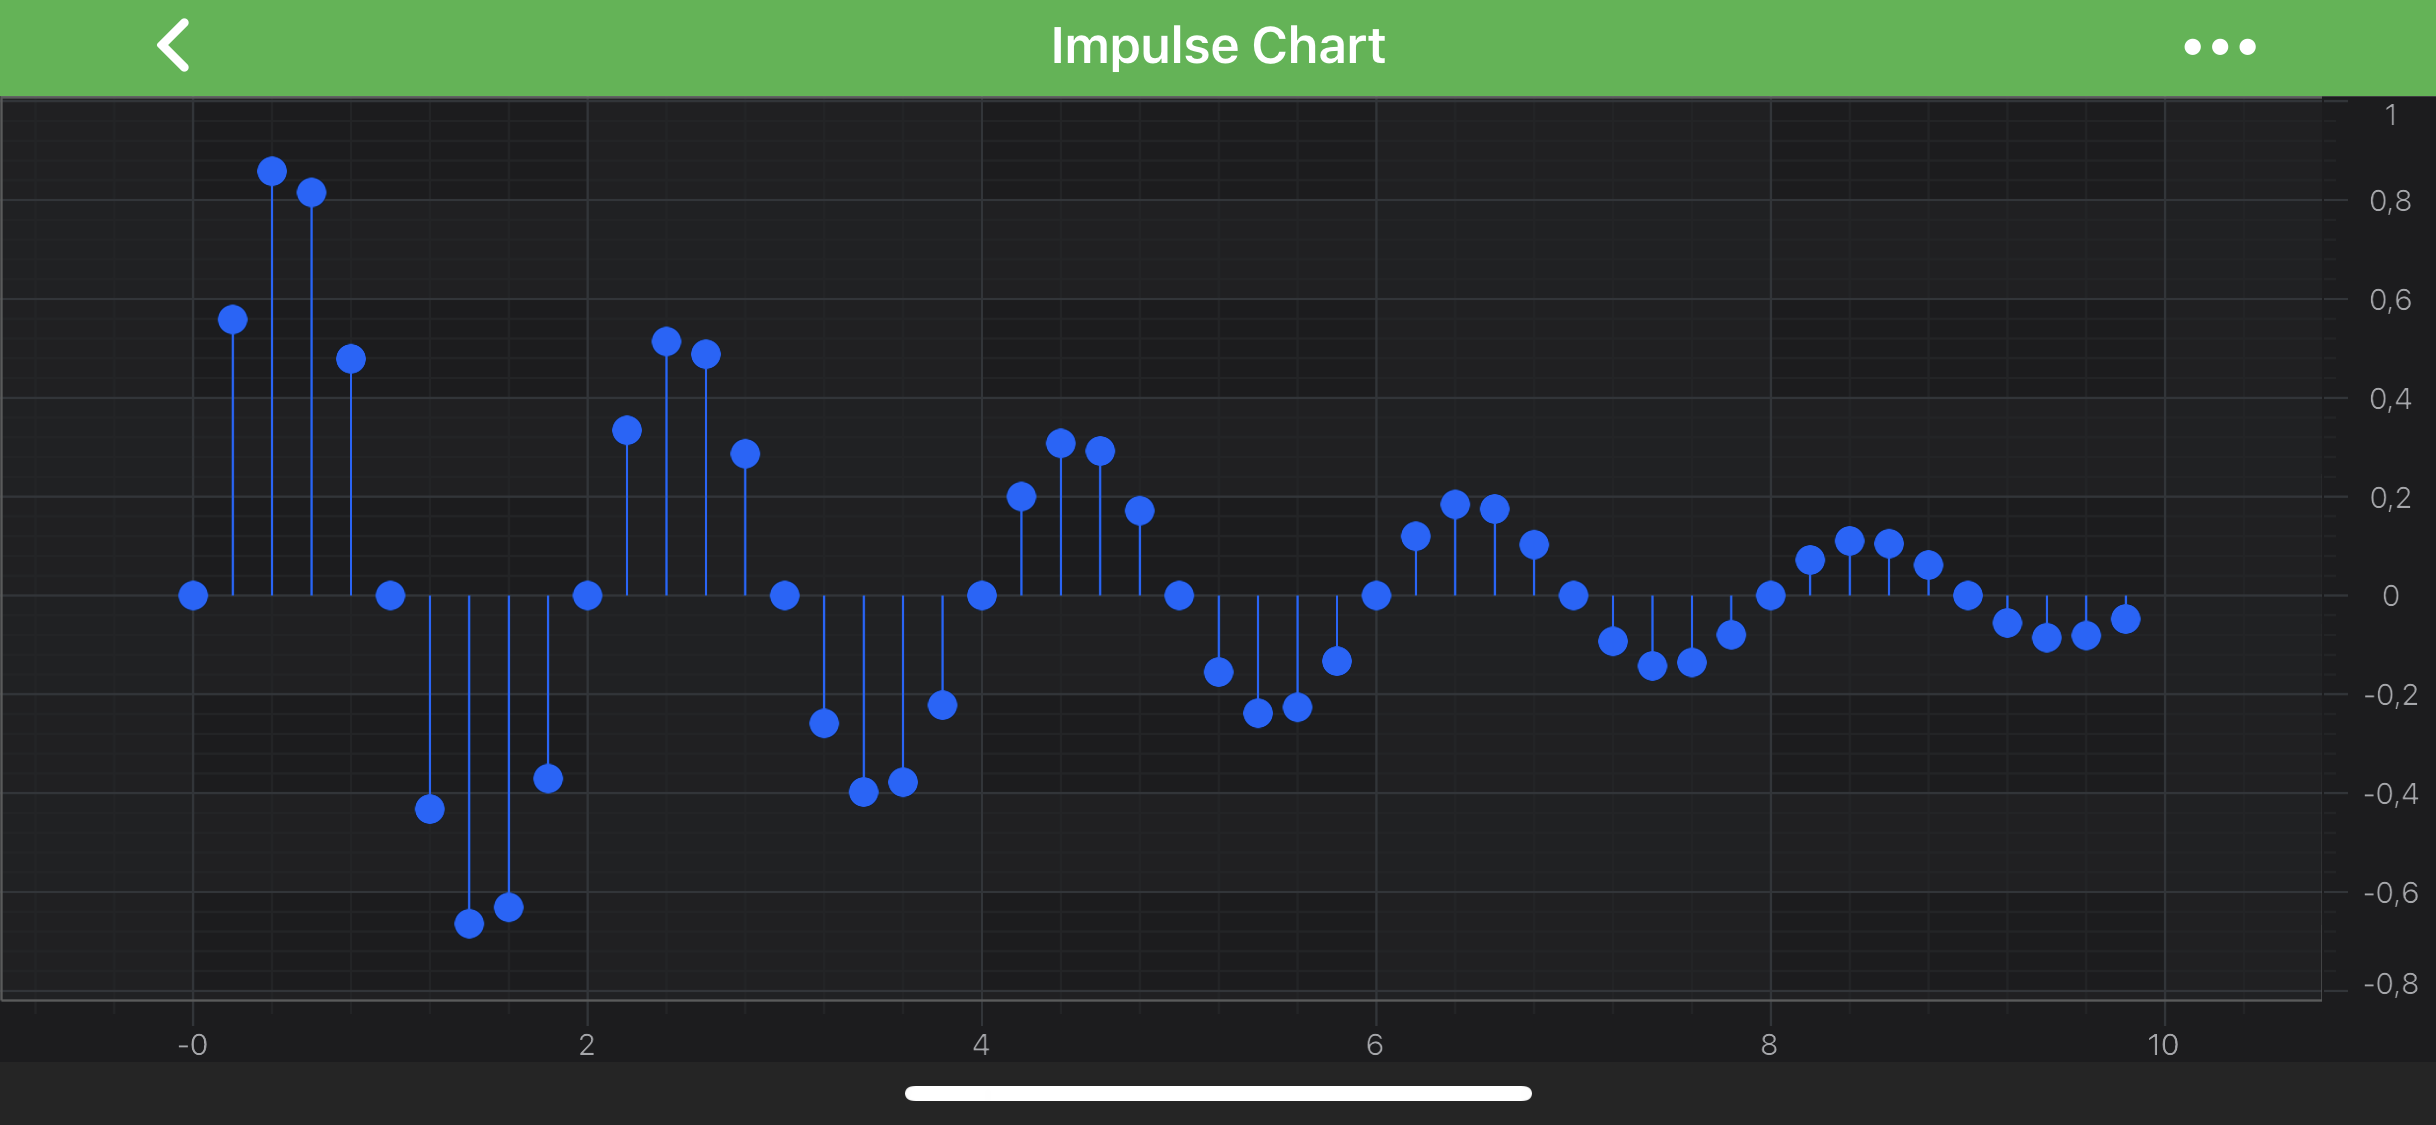 |
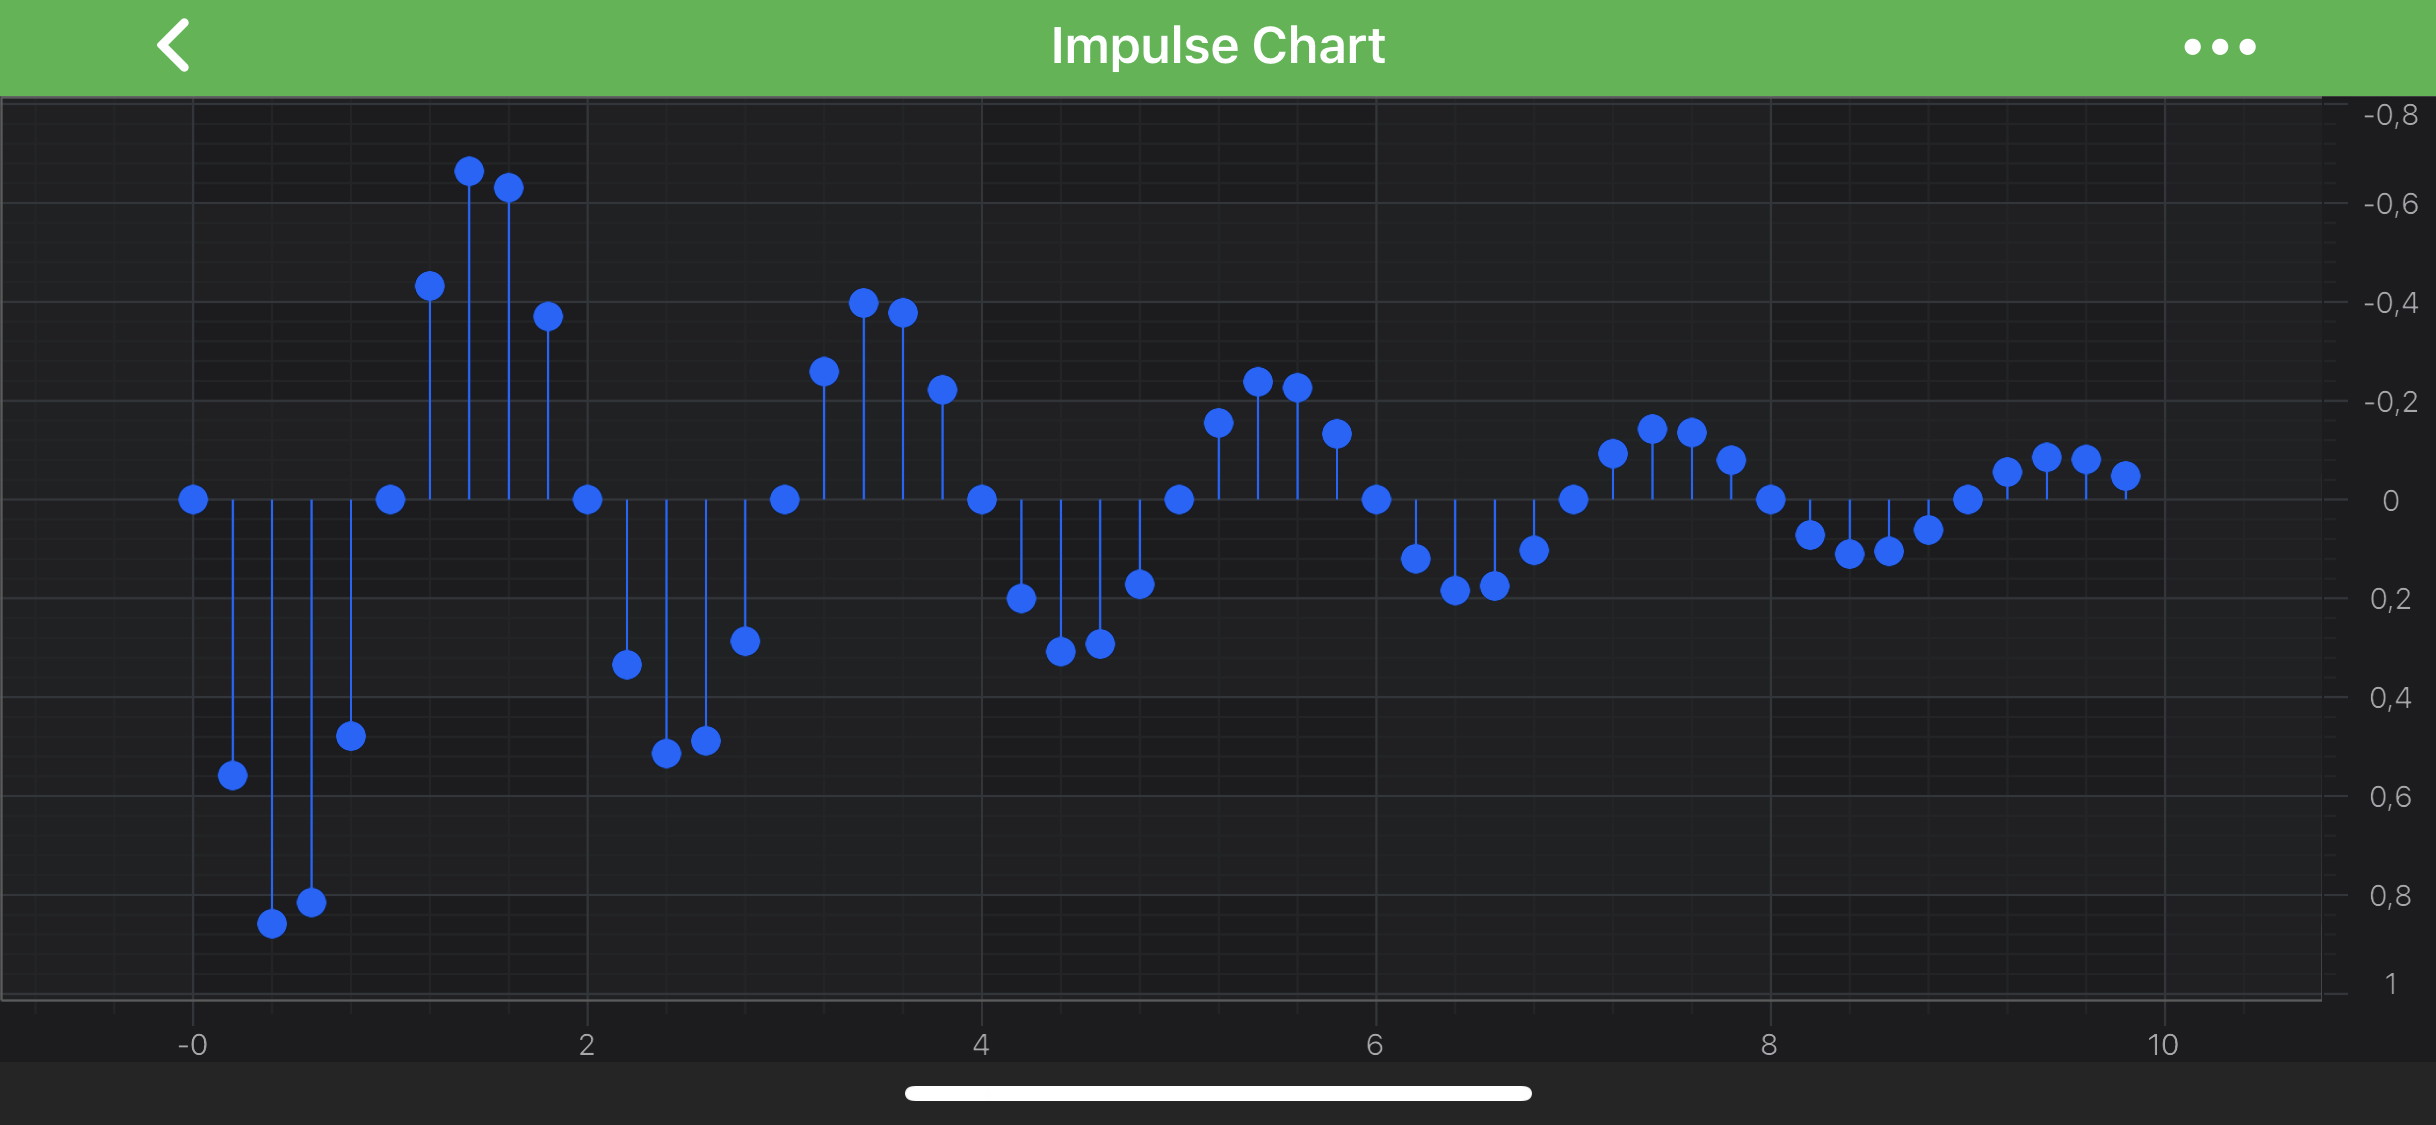 |
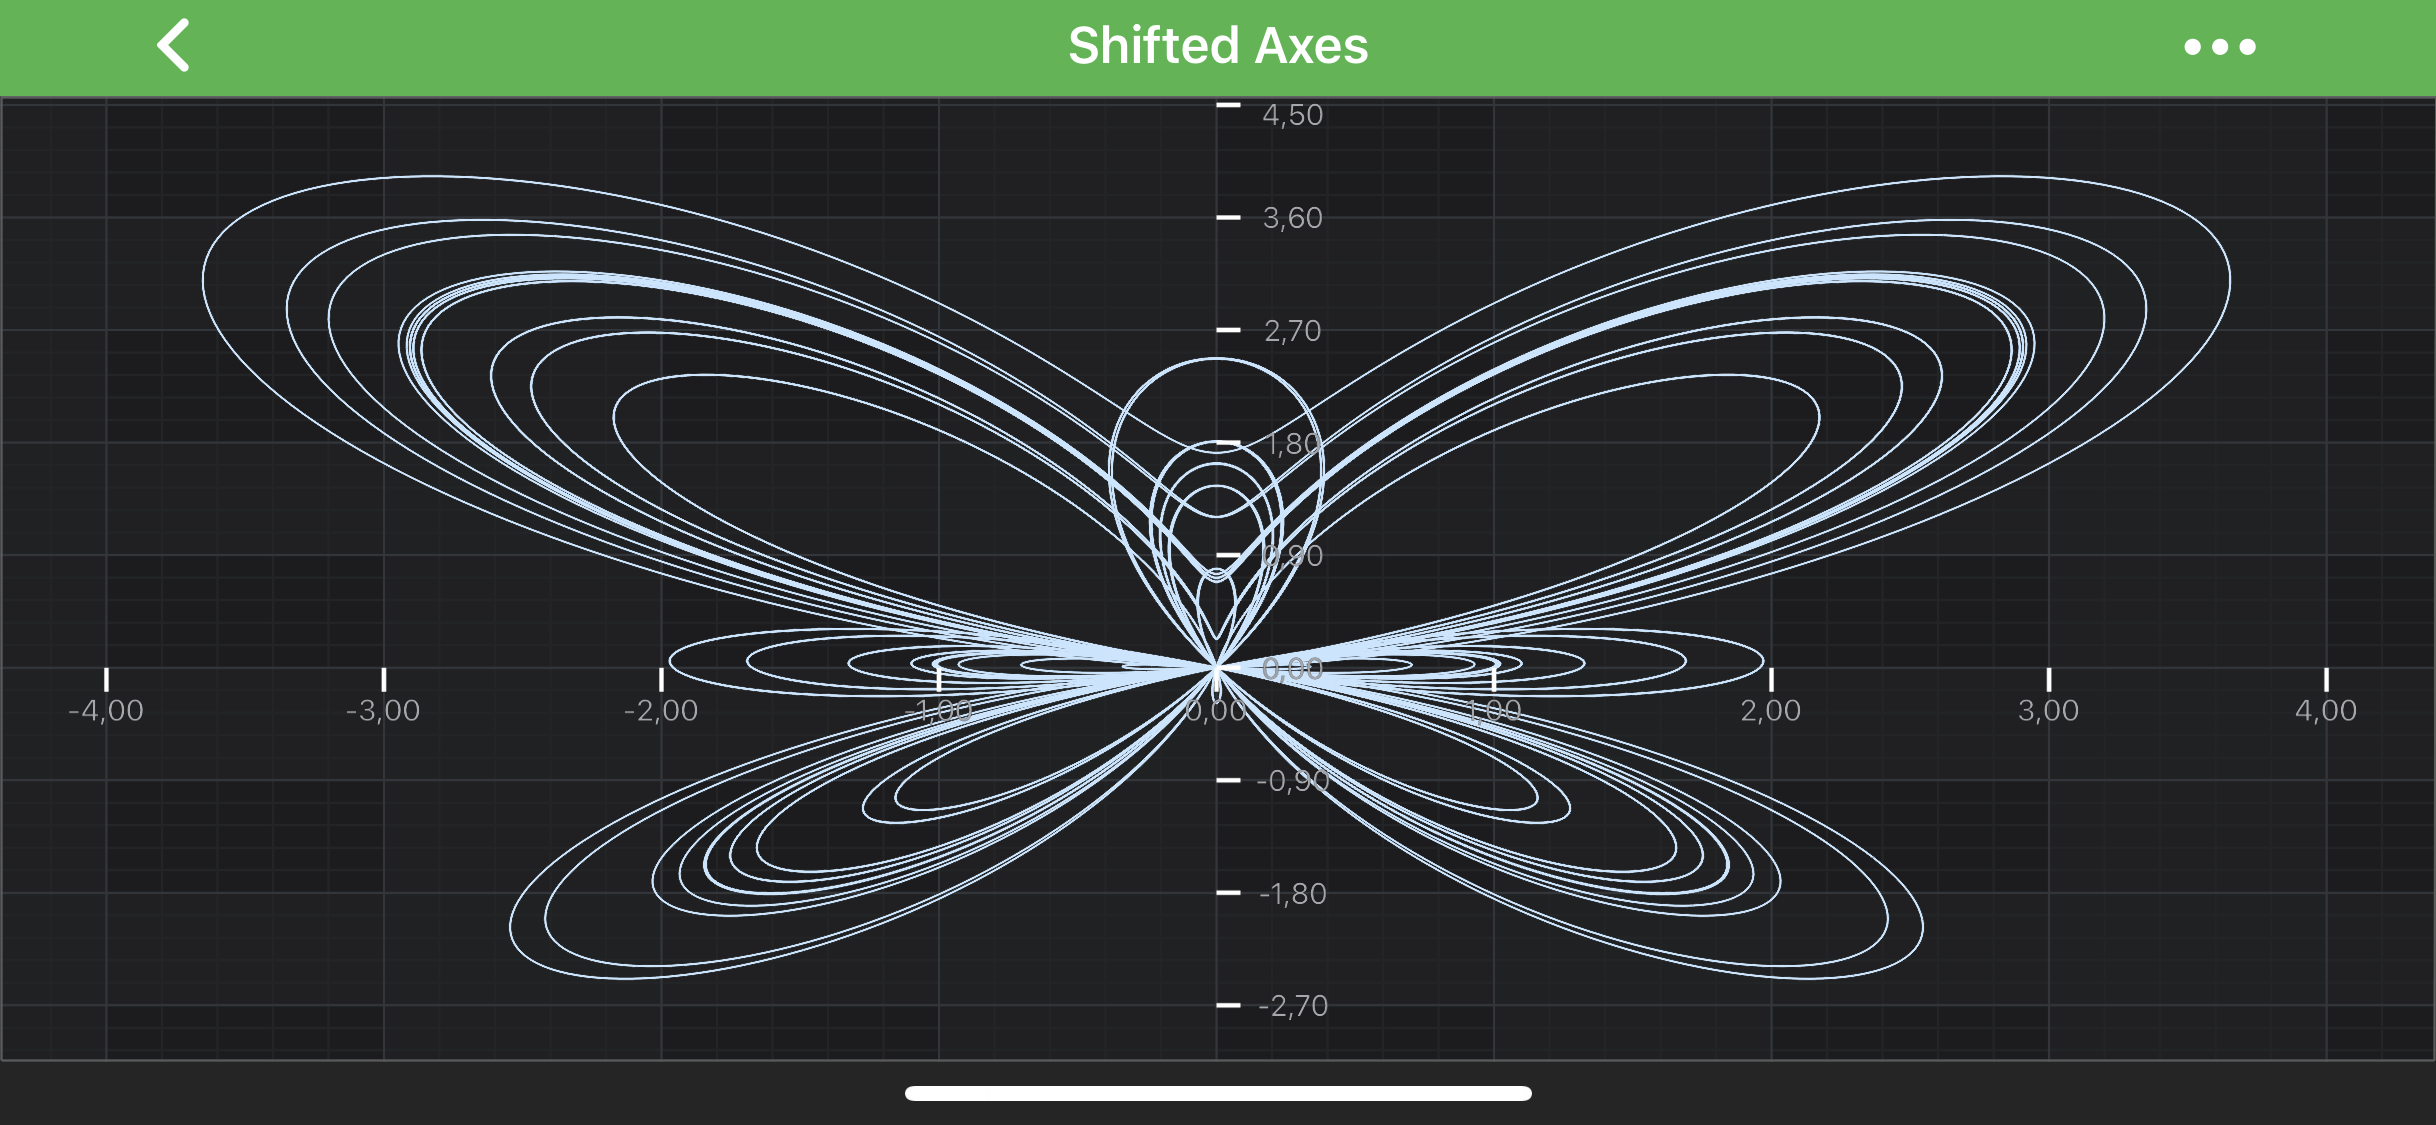
Central Axis
Placing an axis in the center of a chart is a bit more advanced topic. It requires changes to the layout process in ISCILayoutManager to specify the exact axis position inside a chart area. Please refer to the Central Axis article or the Shifted Axes example for more info.
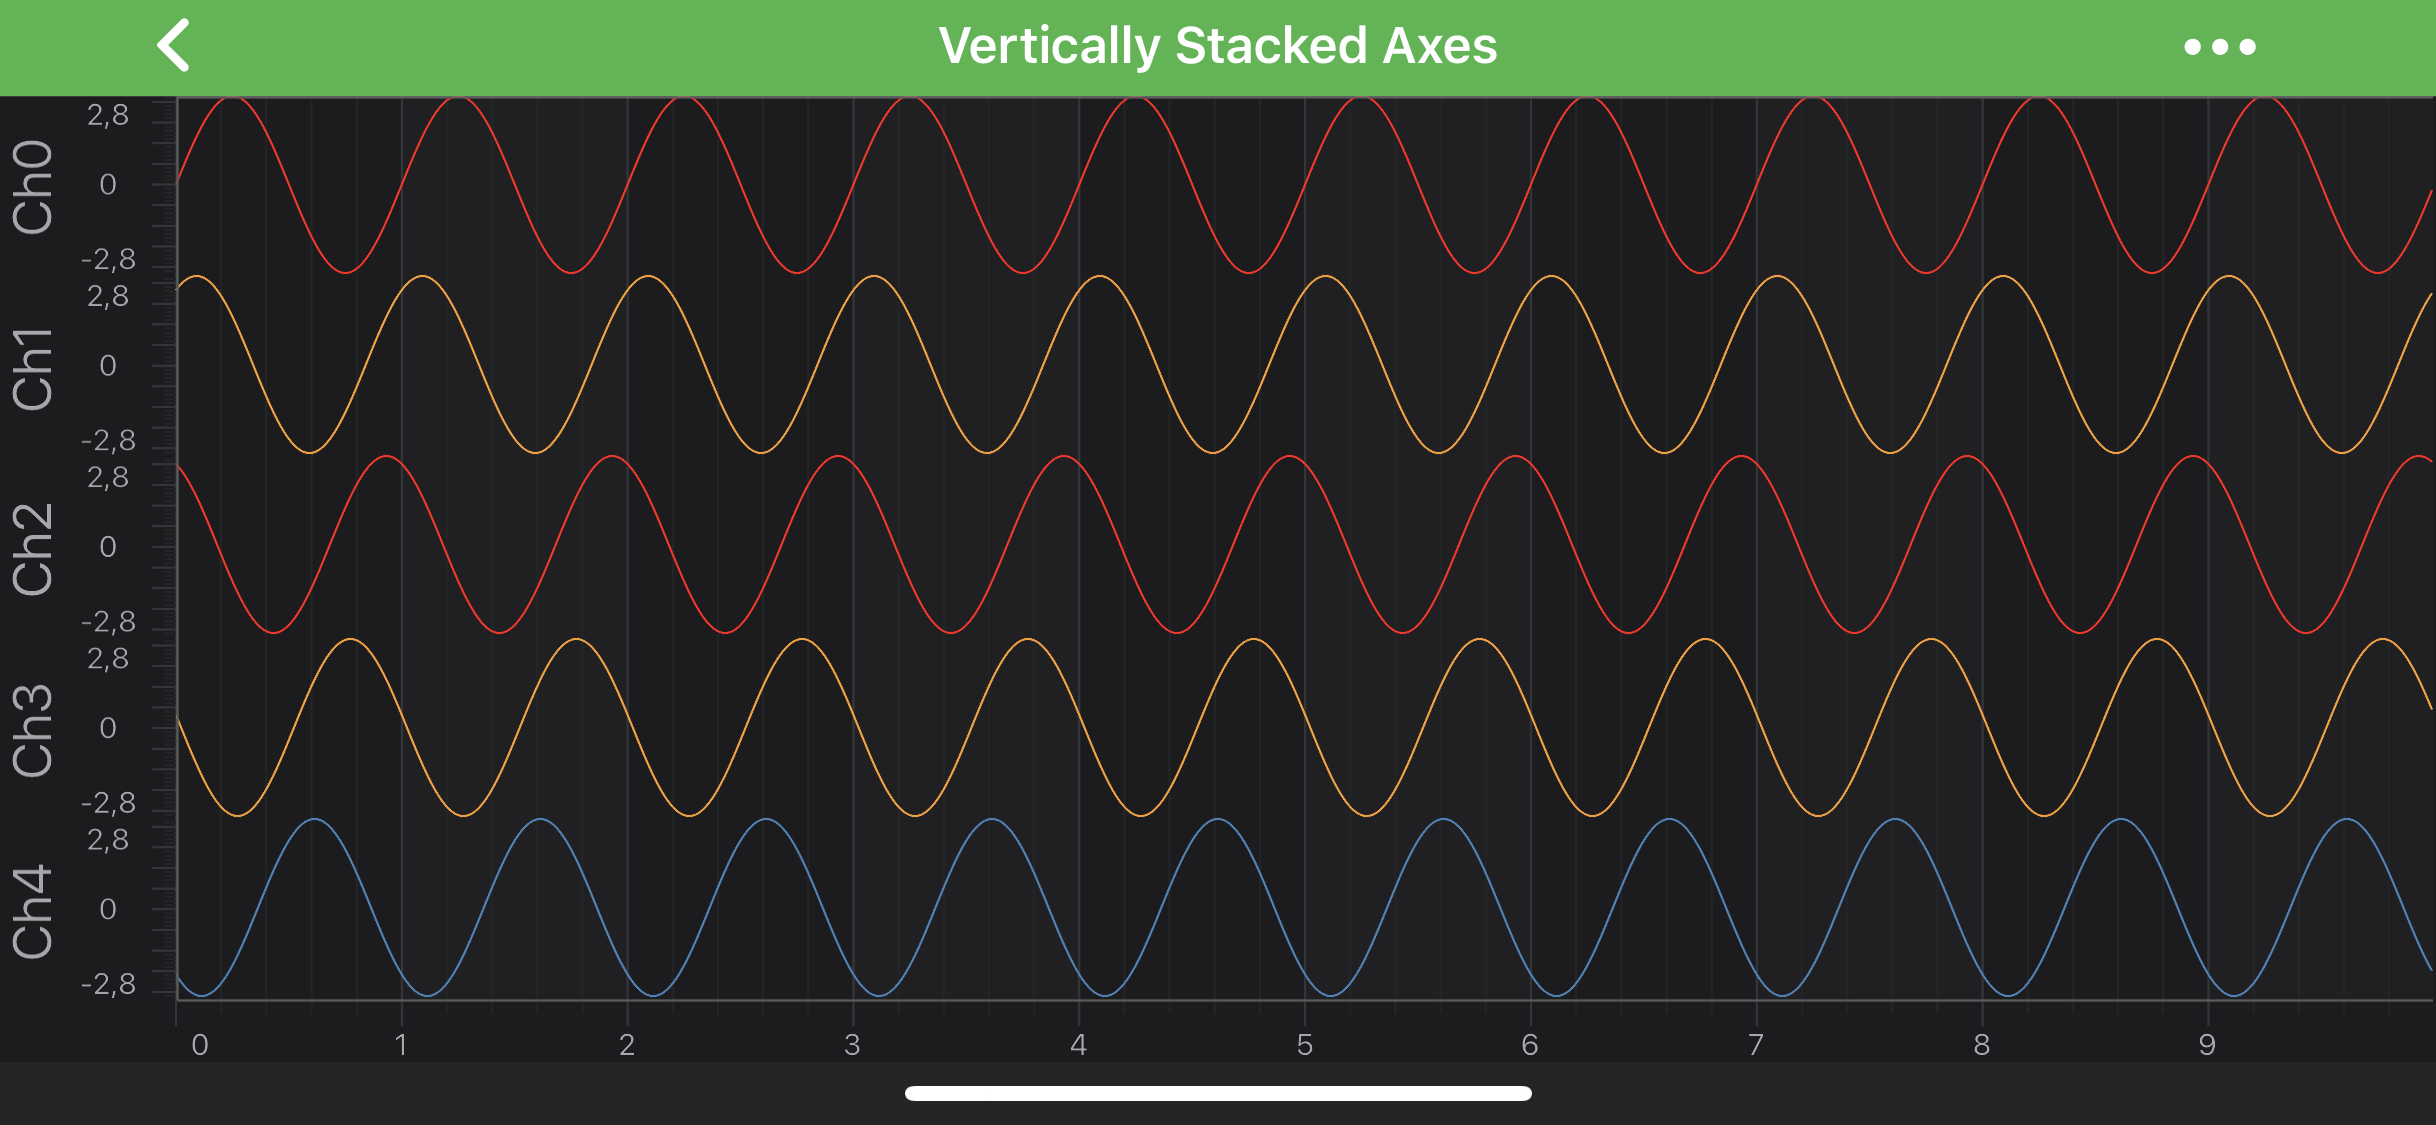
Stacking Multiple Axes Vertically or Horizontally
It is also possible to configure chart layout to have axes placed one next to another vertically or horizontally. This requires changes to the layout process in ISCILayoutManager. Please refer to the Stack Axes Vertically or Horizontally article or the Vertically Stacked Y Axes example for more info.
NOTE: Every RenderableSeries (chart types e.g.
SCIFastLineRenderableSeries,SCIFastCandlestickRenderableSeriesetc.), every Annotation and some Chart Modifiers (e.g.SCIPinchZoomModifier,SCIZoomPanModifier) requires to be measured against particular axis (in other words - attached to it). You must specify the Axis ID for them via theISCIRenderableSeries.xAxisIdandISCIRenderableSeries.yAxisIdproperties.However, If you have only a single X and Y Axis, setting these ID properties isn’t required. This is required only for the multiple axis cases.